. 1998 Nov 1;18(21):8780-93.
doi: 10.1523/JNEUROSCI.18-21-08780.1998.

Myelin gene expression after experimental contusive spinal cord injury

Affiliations

Myelin gene expression after experimental contusive spinal cord injury

J R Wrathall et al. J Neurosci. .

Abstract

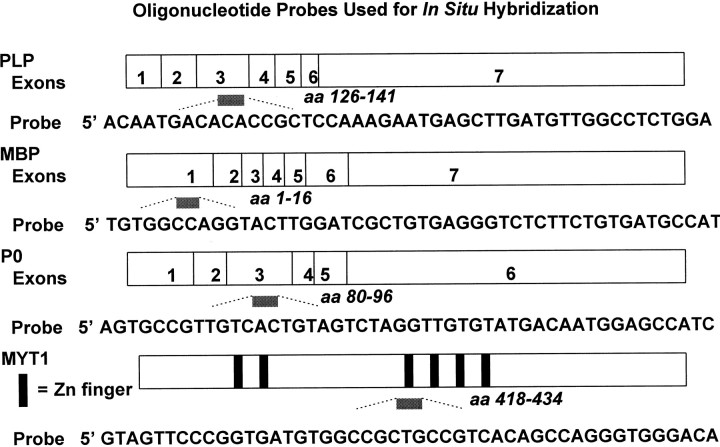
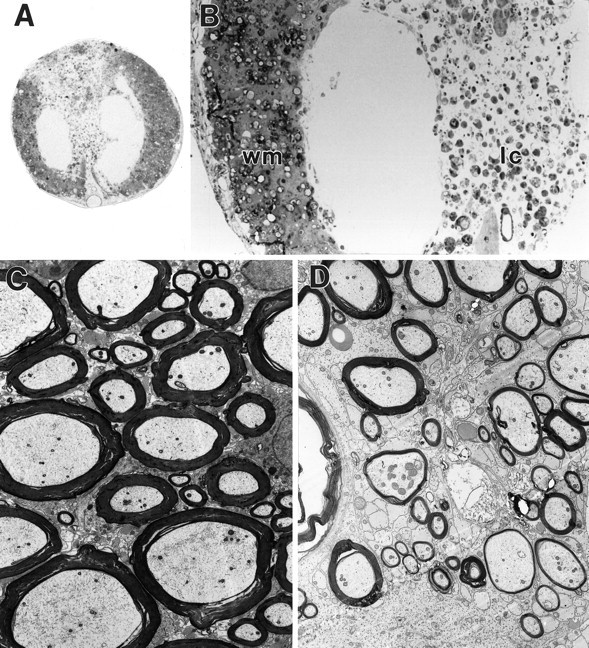
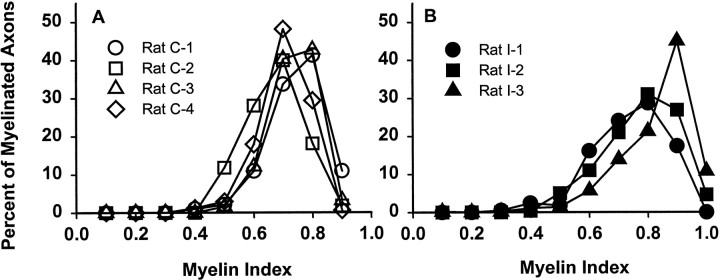
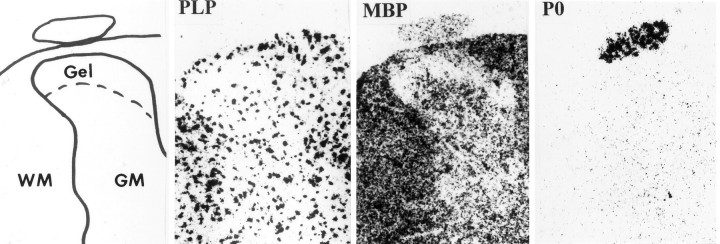
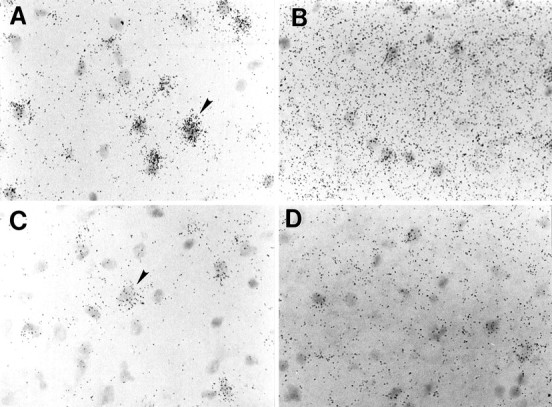
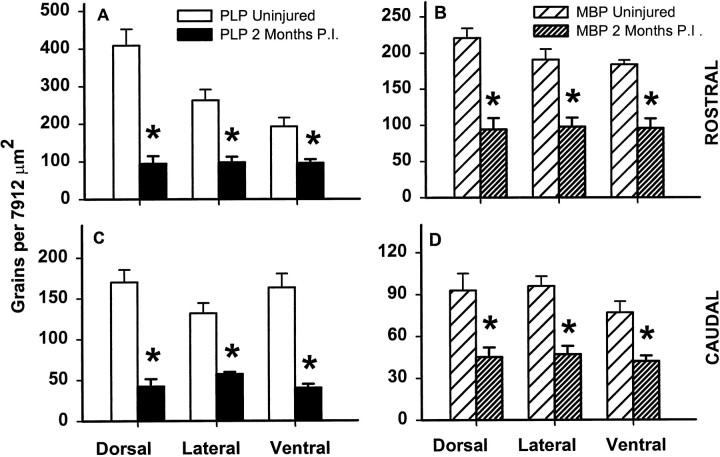
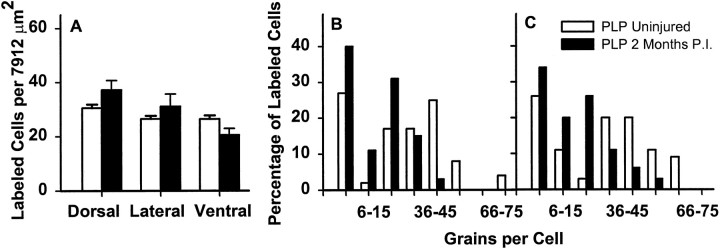
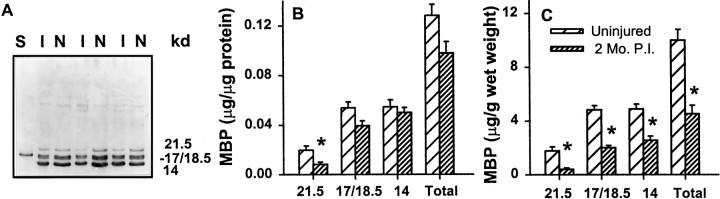
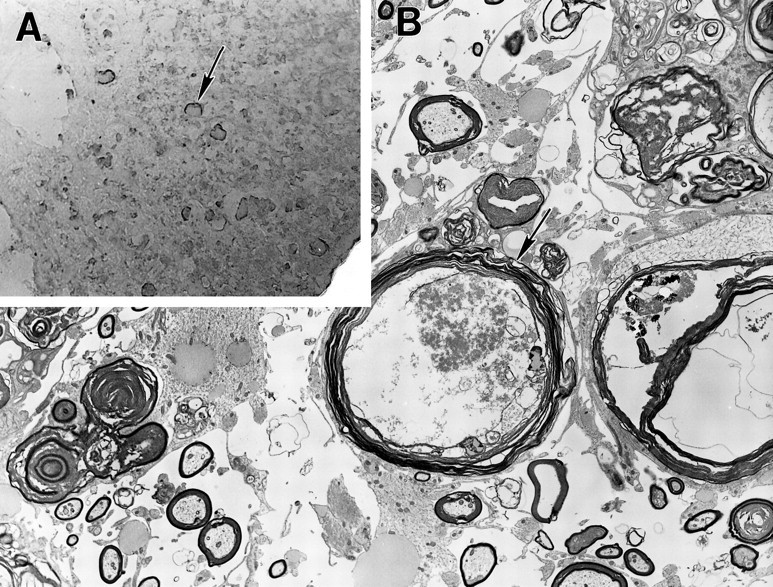
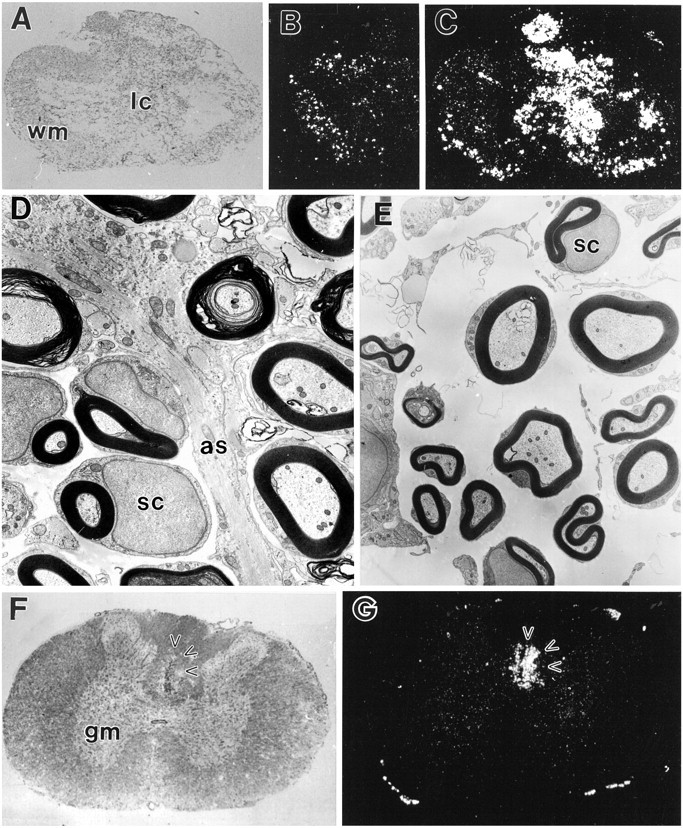
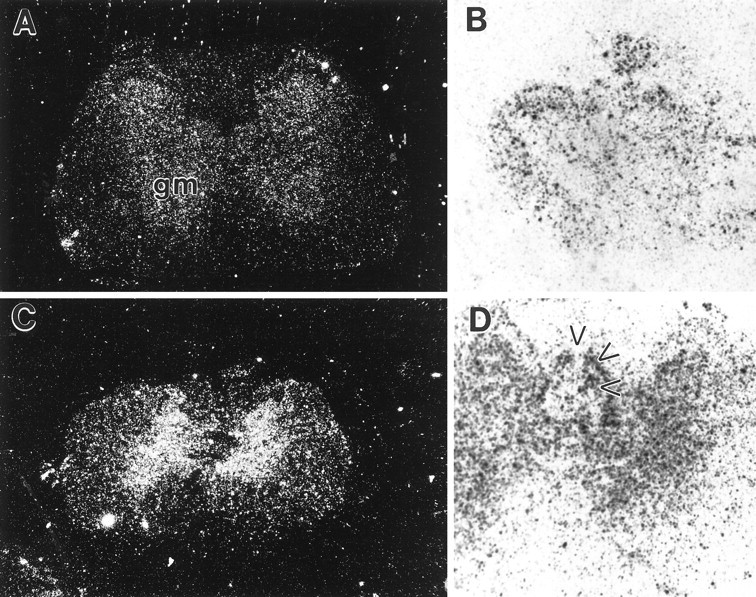
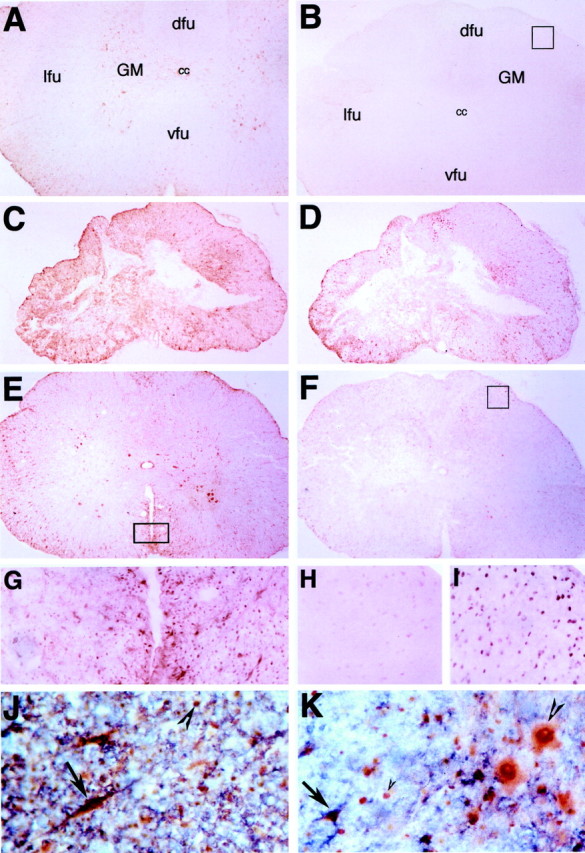
After incomplete traumatic spinal cord injury (SCI), the spared tissue exhibits abnormal myelination that is associated with reduced or blocked axonal conductance. To examine the molecular basis of the abnormal myelination, we used a standardized rat model of incomplete SCI and compared normal uninjured tissue with that after contusion injury. We evaluated expression of mRNA for myelin proteins using in situ hybridization with oligonucleotide probes to proteolipid protein (PLP), the major protein in central myelin; myelin basic protein (MBP), a major component of central myelin and a minor component of peripheral myelin; and protein zero (P0), the major structural protein of peripheral myelin, as well as myelin transcription factor 1 (MYT1). We found reduced expression of PLP and MBP chronically after SCI in the dorsal, lateral, and ventral white matter both rostral and caudal to the injury epicenter. Detailed studies of PLP at 2 months after injury indicated that the density of expressing cells was normal but mRNA per cell was reduced. In addition, P0, normally restricted to the peripheral nervous system, was expressed both at the epicenter and in lesioned areas at least 4 mm rostral and caudal to it. Thus, after SCI, abnormal myelination of residual axons may be caused, at least in part, by changes in the transcriptional regulation of genes for myelin proteins and by altered distribution of myelin-producing cells. In addition, the expression of MYT1 mRNA and protein seemed to be upregulated after SCI in a pattern suggesting the presence of undifferentiated progenitor cells in the chronically injured cord.


Figures

Fig. 1.
Fig. 1.
Oligonucleotide probe sequences used and the location of these sequences in their respective genes.
Fig. 2.
Fig. 2.
The injury epicenter at 2 months after incomplete contusive SCI. A, One micrometer plastic section showing the partial peripheral rim of residual white matter surrounding a central lesion cavity containing a loose accumulation of cells. 22×.B, Higher magnification showing residual white matter (wm), central cavity, and cells in the lesioned area (lc). 80×. C, D, Electron micrographs of ventral white matter from a normal uninjured spinal cord (C) and a lesion epicenter (D). 5000×. Compared with normal, the residual white matter of the chronic epicenter demonstrates reduced axon density interspersed with hypertrophic astrocytic processes resulting in a pale interaxonal matrix. Large axons are conspicuously absent, and the myelination of the remaining axons is frequently thinner than normal.
Fig. 3.
Fig. 3.
The myelin index (ratio of axon diameter to the diameter of the axon plus its myelin sheath) of axons in normal and chronic SCI ventromedial white matter. A, The index showed an approximately normal distribution with a peak at 0.7 or 0.8 for axons in the ventromedial white matter of four normal rats (n = 92–124 axons per rat). B, The distribution curves appeared wider and peaked at a higher ratio (thinner myelin), ranging from 0.8 to 0.9, in the preserved ventromedial white matter in three rats at 2 months after SCI (n = 100–167 axons per rat).
Fig. 4.
Fig. 4.
Pattern of myelin gene expression in normal adult rat spinal cord. Diagram of the dorsal horn region of a spinal cord cross-section indicates the location of gray matter (GM) of the dorsal horn with the superficial substantia gelatinosa (Gel) that is devoid of myelin, lateral-myelinated white matter (WM), and, external to the cord, a portion of a peripheral dorsal nerve root. Sequential serial sections hybridized with probes for myelin structural protein genes show PLP expression absent in the nerve root and substantia gelatinosa but heavily expressed in the white matter with a clumped pattern. MBP expression has a similar distribution in the spinal cord, but grains are more dispersed; MBP also shows some expression in the dorsal root. P0 is not seen in the spinal cord but is heavily expressed in a clumped pattern in the dorsal root. 44×.
Fig. 5.
Fig. 5.
Reduced expression of PLP and MBP mRNA chronically after SCI. A, PLP expression in normal uninjured ventromedial white matter is primarily seen as grains associated with a subset of nuclei in the white matter. B, MBP expression is more evenly distributed over nuclei and cell processes.C, PLP expression shows the same distribution but appears reduced in amount in a section that is 4 mm caudal to the epicenter from a cord at 2 months after SCI and that was mounted on the same slide shown in A. D, MBP expression that is 4 mm caudal to the epicenter is also reduced as seen in this section of injured tissue from the same slide shown inB. A–D, 158×.Arrowheads, PLP-positive cells.
Fig. 6.
Fig. 6.
Quantification of the relative expression of PLP and MBP mRNA in normal white matter and residual white matter at 2 months after SCI. White matter in the dorsal, lateral, and ventral funiculi both rostral (A, B) and caudal (C, D) showed significantly reduced grain counts per area for PLP (A, C) and MBP (B, D) in injured compared with normal tissue mounted on the same slide. Bars represent the mean ± SEM of grains counted in six sampled areas (7912 μm2each); * indicates values significantly different from uninjured control tissue on the same slide (t test,p ≤ 0.05). P.I., Postinjury.
Fig. 7.
Fig. 7.
PLP mRNA-expressing cells and the relative expression per cell at 2 months after SCI.A, Comparison of the number of cell nuclei per area positive for grains greater than background after hybridization with the PLP probe in normal and injured white matter. Bars represent mean number ± SEM based on six to eight areas analyzed for each white matter region from sections on the same slide representing normal and chronic injured tissue at 4 mm rostral to the epicenter.B, C, Frequency distributions of net grains per cell in labeled cells in the ventral white matter at 4 mm rostral (B) and 4 mm caudal (C) to the epicenter of in-jured compared with normal tissue on the same slides. Net grains (minus background) were counted in 227 μm2 circles centered on each nucleus in the areas sampled for a total of 35–40 cells analyzed per group. P.I., Postinjury.
Fig. 8.
Fig. 8.
Expression of MBP protein after SCI.A, Western blots showed three major bands of MBP-immunoreactive protein in myelin preparations from normal thoracic spinal cord (N) and in tissue from the injury sites at 2 months after SCI (I).S, MBP standard. Molecular weights in kilodaltons (kDa) of the major bands are shown on the right.B, Quantification of MBP bands as micrograms per microgram of total protein applied in normal and injured samples (n = 5) shows a significant (*) reduction in band 1 (t test, p ≤ 0.05).C, MBP expressed as micrograms per gram wet weight of spinal cord tissue demonstrates significant (*) reductions in each isoform as well as in total MBP. P.I., Postinjury.
Fig. 9.
Fig. 9.
Myelin microcysts and debris at 2 months after SCI. A, Immunocytochemistry with antibody to MBP demonstrates staining primarily associated with spherical microcyst-like structures (arrow) seen in the residual white matter of the chronic injury epicenter. 79×. B, Myelin microcysts (arrow) and debris seen by electron microscopy at 2 months after injury are shown. 4250×.
Fig. 10.
Fig. 10.
P0 expression in the chronic injured spinal cord.A, SCI epicenter at 2 months after injury with a peripheral rim of residual white matter (wm) and cells in the lesion area (lc) within the central cavity is shown. 35×. B, Dark-field microscopy of in situ hybridization demonstrating PLP expression in an adjacent section is reduced and restricted to the peripheral rim of residual white matter. C, P0 expression is strong both in acircular profile of dorsal root near thetop of the field as well as in the lesion zone of the epicenter and also shows an expanded distribution near the dorsal and ventral root entry zones. D, Electron microscopy of the junction between residual spinal cord tissue and lesion zone reveals many Schwann cell (sc)-ensheathed axons near an astrocytic process (as). 10,000×. E, In the lesion zone at the center of the epicenter, axons myelinated by Schwann cells (sc) are frequently seen. 6000×.F, At 4 mm caudal to the epicenter, the lesion (arrowheads) is restricted to the dorsal funicular white matter. 28×. G, In situhybridization shows strong expression of P0 mRNA in this lesion area (arrowheads).
Fig. 11.
Fig. 11.
MYT1 mRNA expression in the normal spinal cord and 2 months after SCI. A, In the uninjured cord, MYT1 mRNA was barely detected in the white matter and was low in gray matter (gm). B, MYT1 mRNA expression at the lesion epicenter in a section adjacent to those shown in Figure10A–C is shown. Expression is seen in the rim of residual white matter, in the central lesion zone, and even in some foci within an expanded dorsal root that appears in Figure10C to be intensely positive for P0. C, At 4 mm rostral to the epicenter, MYT1 is increased both in white matter and especially in gray matter. D, At 4 mm caudal to the injury site, in a section adjacent to those shown in Figure 10,F and G, MYT1 mRNA appears primarily but not completely absent in the lesion zone where PO expression is intense (Fig. 10G) and seems especially prominent immediately adjacent to the lesion zone (arrowheads).A, C: Dark field, 26×. B,D: Bright field, 38×.
Fig. 12.
Fig. 12.
Immunostaining for MYT1(A,C, E, G,J) and MYT1L (B, D,F, H, I,K) proteins in normal and injured spinal cord.A, In the normal spinal cord, MYT1 immunoreactivity is present in cells of the central canal, in large neurons in the gray matter, and to a lesser extent in cells in the white matter.B, MYTL1 immunoreactivity in the uninjured cord is very faint. C, At the lesion epicenter 6 weeks after SCI, the intensity of MYT1 immunostaining is increased both in the peripheral rim of preserved white matter and in the central lesion zone.D, MYT1L staining at the epicenter in an adjacent section is also increased but limited to portions of the peripheral rim of white matter. E, Four millimeters distal to the epicenter, MYT1 expression is still greater than that in normal cord both in large neurons in the gray matter and in the white matter.F, An adjacent section shows increased MYT1L immunoreactivity. G, The most intense MYT1 expression is in the ventromedial white matter (boxed region inE) where many nuclei of small round cells are positive as well as in the cytoplasm of cells with the morphology of astrocytes.H, Enlargement of the boxed region inB shows MYT1L immunoreactivity only in the most superficial layers of the dorsal horn of normal spinal cord.I, Similar enlargement of the dorsal horn (boxed region in F) indicates that after SCI the proportion of MYT1L-labeled cells is much increased.J, Double immunocytochemistry for MYT1 (brown) and GFAP (blue) shows that reactive astrocytes in white matter express both antigens (arrow) in their hypertrophic processes. MYT1-positive nuclei (arrowhead) are also present in many GFAP-negative cells. K, Double immunocytochemistry for MYT1L (brown) and GFAP (blue) shows that some reactive astrocytes in white matter express both antigens (arrow); other astrocytic processes are MYT1L-negative. MYT1L staining is seen in the nuclei of GFAP-negative cells in the white matter (small arrowhead) and in both the nucleus and cytoplasm of large ventral horn neurons (large arrowhead) in the adjacent gray matter. cc, Central canal; dfu, dorsal funiculus; GM, gray matter; lfu, lateral funiculus; vfu, ventral funiculus. A–F: 35×. G–I: 135×. J, K: 320×.
Fig. 13.
Fig. 13.
Double immunostaining for MYT1 and the oligodendrocyte marker CC1 (A, B) or the microglial marker OX42 (C, D). At 6 weeks after injury, sections 4 mm from the epicenter demonstrate ventromedial immunostaining for MYT1 (brown) as well as CC1 (blue; A, B) and OX42 (blue; C, D). However, at high magnification, no colocalization of MYT1 (arrow) staining was seen with CC1 (B, arrowhead) or OX42 (D, arrowhead). A,C: 280×. B, D: 630×.

Similar articles

Cited by

References

    1. Armstrong RC, Dorn HH, Kufta CV, Friedman E, Dubois-Dalcq ME. Pre-oligodendrocytes from adult human CNS. J Neurosci. 1992;12:1538–1547. - PMC - PubMed
    1. Armstrong RC, Kim JG, Hudson LD. Expression of myelin transcription factor I (MyTI), a “zinc-finger” DNA-binding protein, in developing oligodendrocytes. Glia. 1995;14:303–321. - PubMed
    1. Armstrong RC, Migneault A, Shegog ML, Kim JG, Hudson LD, Hessler RB. High-grade human brain tumors exhibit increased expression of myelin transcription factor 1 (MYT1), a zinc finger DNA-binding protein. J Neuropathol Exp Neurol. 1997;56:772–781. - PubMed
    1. Balentine JD. Pathology of experimental spinal cord trauma. II. Ultrastructure of axons and myelin. Lab Invest. 1978;39:254–266. - PubMed
    1. Bhat RV, Axt KJ, Fosnaugh JS, Smith KJ, Johnson KA, Hill DE, Kinzler KW, Baraban JM. Expression of the APC tumor suppressor protein in oligodendroglia. Glia. 1996;17:169–174. - PubMed

Publication types

MeSH terms