. 1998 Nov 1;18(21):8936-46.
doi: 10.1523/JNEUROSCI.18-21-08936.1998.

The major cell populations of the mouse retina

Affiliations

The major cell populations of the mouse retina

C J Jeon et al. J Neurosci. .

Abstract

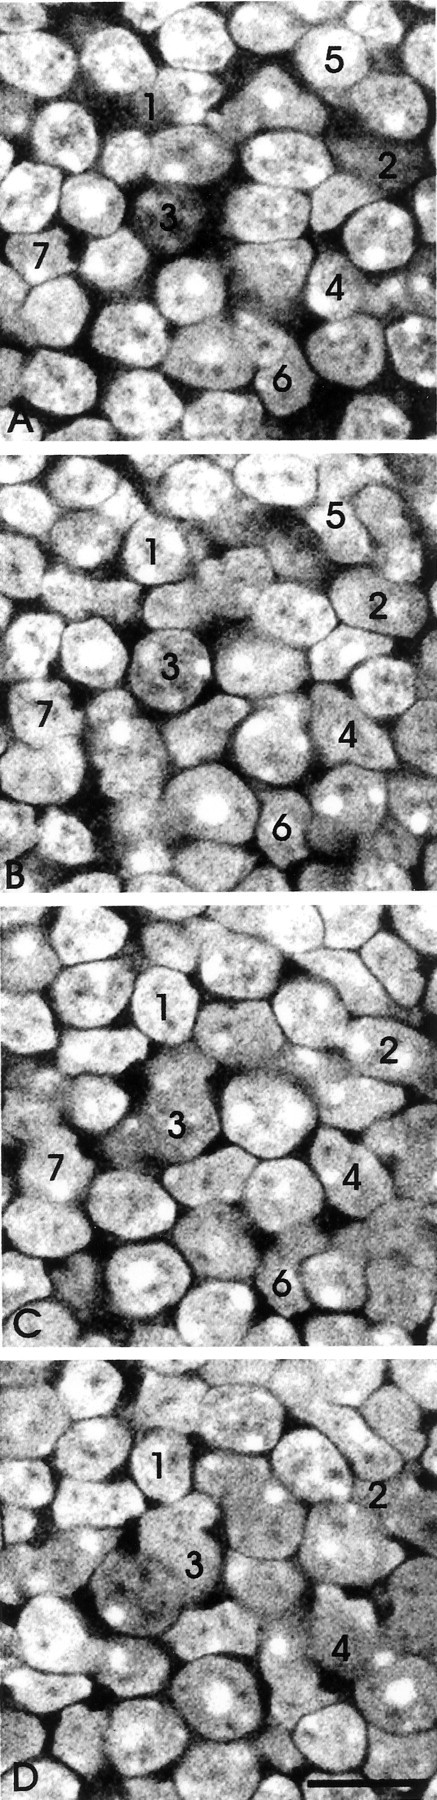
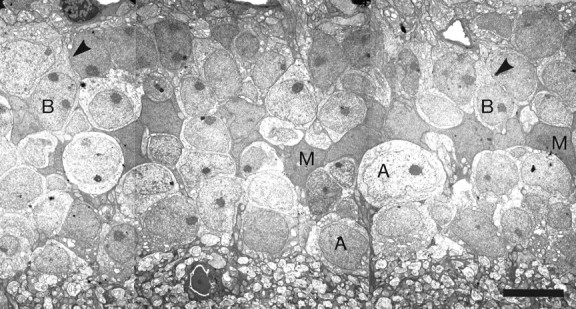
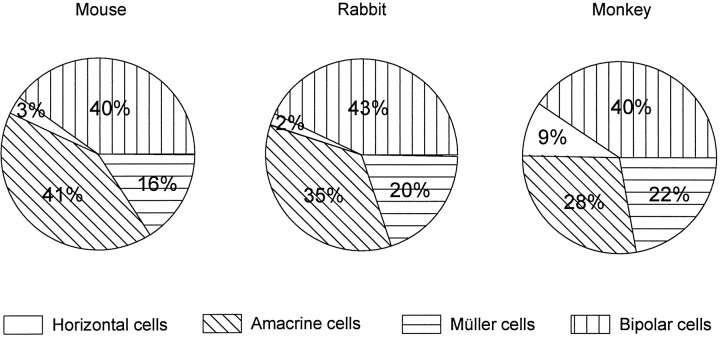
We report a quantitative analysis of the major populations of cells present in the retina of the C57 mouse. Rod and cone photoreceptors were counted using differential interference contrast microscopy in retinal whole mounts. Horizontal, bipolar, amacrine, and Müller cells were identified in serial section electron micrographs assembled into serial montages. Ganglion cells and displaced amacrine cells were counted by subtracting the number of axons in the optic nerve, learned from electron microscopy, from the total neurons of the ganglion cell layer. The results provide a base of reference for future work on genetically altered animals and put into perspective certain recent studies. Comparable data are now available for the retinas of the rabbit and the monkey. With the exception of the monkey fovea, the inner nuclear layers of the three species contain populations of cells that are, overall, quite similar. This contradicts the previous belief that the retinas of lower mammals are "amacrine-dominated", and therefore more complex, than those of higher mammals.


Figures

Fig. 1.
Fig. 1.
The mosaic of rods and cones in the mouse retina. DIC optics, focal plane through the photoreceptor inner segments. The lighter, more or less polygonal, structures are rod inner segments. The inner segments of cones are outlined darkly by the diaminobenzidine reaction product. Scale bar, 10 μm.
Fig. 2.
Fig. 2.
Serial confocal sections at 1 μmz intervals through the inner nuclear layer. All nuclei of the layer were labeled with ethidium homodimer. The cells were counted by following individual cells through the series, as illustrated for the numbered examples. Scale bar, 10 μm.
Fig. 3.
Fig. 3.
Low-power electron microscopy of the inner nuclear layer. Series of montages (part of one is shown) were assembled for locations in the central and peripheral retinas. Within each series of montages, every cell of the inner nuclear layer was identified. This was done by visualizing the axons or dendrites of the cells as they left the soma; examples are indicated by arrowheads. Scale bar, 5 μm.
Fig. 4.
Fig. 4.
Neurons of the ganglion cell layer. The top panel (A) shows a confocal image of the ganglion cell layer, as seen after staining with ethidium. Under these conditions both DNA and RNA are stained, so that extranuclear cytoplasm is revealed (arrows). The nuclei of glia and endothelial cells (arrowhead) were not counted. The two graphs (B, C) show the numbers of cells encountered along two axes (dorsoventral and nasotemporal) intersecting the optic nerve head. Counts are from the Italian colony of C57/BL6 mice.
Fig. 5.
Fig. 5.
Electron micrograph from transverse ultrathin section of the mouse optic nerve. Both large- and small-size axons are visible in this field, and all of them are myelinated. This magnification is approximately the same used for counting fibers.Nu, Nucleus of a glial cell. Scale bar, 1 μm.
Fig. 6.
Fig. 6.
The distribution of ChAT-positive (starburst) cells across three mouse retinas. In the top micrograph(A) the ChAT-positive neurons are, labeled here with Cy3, shown in red. They form two populations, one in the inner nuclear layer and one in the ganglion cell layer. Their dendrites are stratified narrowly in two bands. The middle micrograph (B) shows a collapsed whole-mount view. The ChAT cells of the inner nuclear layer arered, and those of the ganglion cell layer aregreen. The bottom micrograph(C) shows the mosaic of stained dendrites within the inner plexiform layer.
Fig. 7.
Fig. 7.
Comparative distributions of the major cell classes in the retina of the mouse. All data are from the American colony of C57/BL6 mice.
Fig. 8.
Fig. 8.
The distribution of classes of cells in the mouse, rabbit, and monkey. Data for the mouse average the central and peripheral retinas. Data for the rabbit are from Strettoi and Masland (1995). Data for the monkey are from Martin and Grünert (1992).

References

    1. Altman DG. Practical statistics for medical research. Chapman and Hall; New York: 1991.
    1. Bevington PR, Robinson DK. Data reduction and error analysis for the physical science, 2nd Ed, pp 38–52. McGraw-Hill; New York: 1992.
    1. Blanks JC, Johnson LV. Specific binding of peanut lectin to a class of retinal photoreceptor cells. Invest Ophthalmol Vis Sci. 1984;25:546–557. - PubMed
    1. Bonfanti L, Strettoi E, Chierzi S, Cenni MC, Liu X-H, Martinou J-C, Maffei L, Rabacchi SA. Protection of retinal ganglion cells from natural and axotomy-induced cell death in neonatal transgenic mice over-expressing bcl-2. J Neurosci. 1996;16:4186–4194. - PMC - PubMed
    1. Carter-Dawson LD, LaVail MM. Rods and cones in the mouse retina. J Comp Neurol. 1979;188:245–262. - PubMed

Publication types

MeSH terms

LinkOut - more resources