. 1998 Nov 1;18(21):8965-78.
doi: 10.1523/JNEUROSCI.18-21-08965.1998.

Task-dependent viscoelasticity of human multijoint arm and its spatial characteristics for interaction with environments

Affiliations

Task-dependent viscoelasticity of human multijoint arm and its spatial characteristics for interaction with environments

H Gomi et al. J Neurosci. .

Abstract

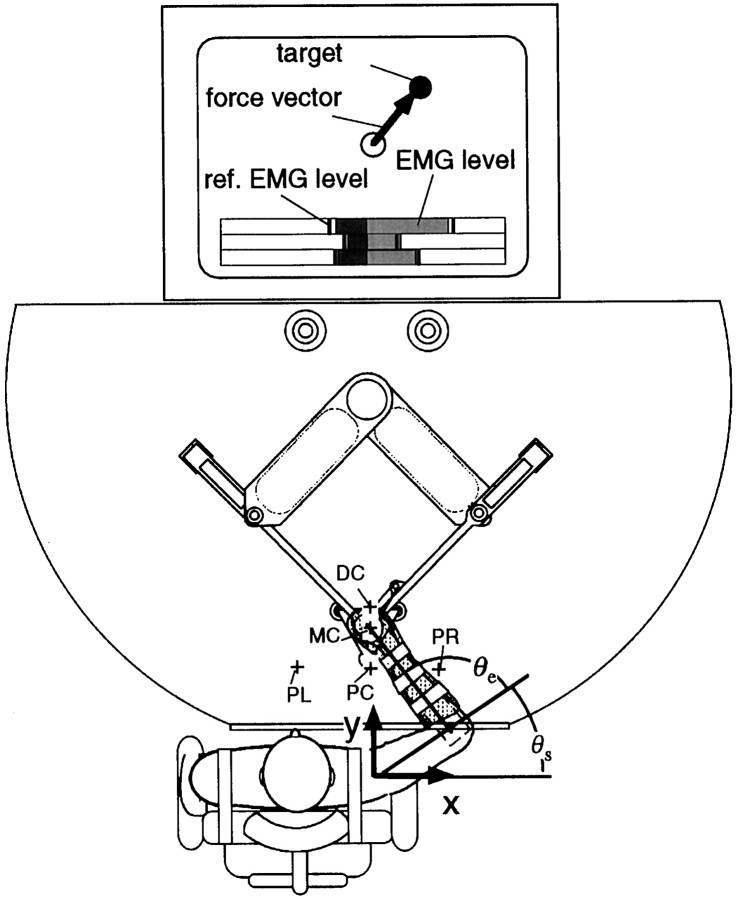
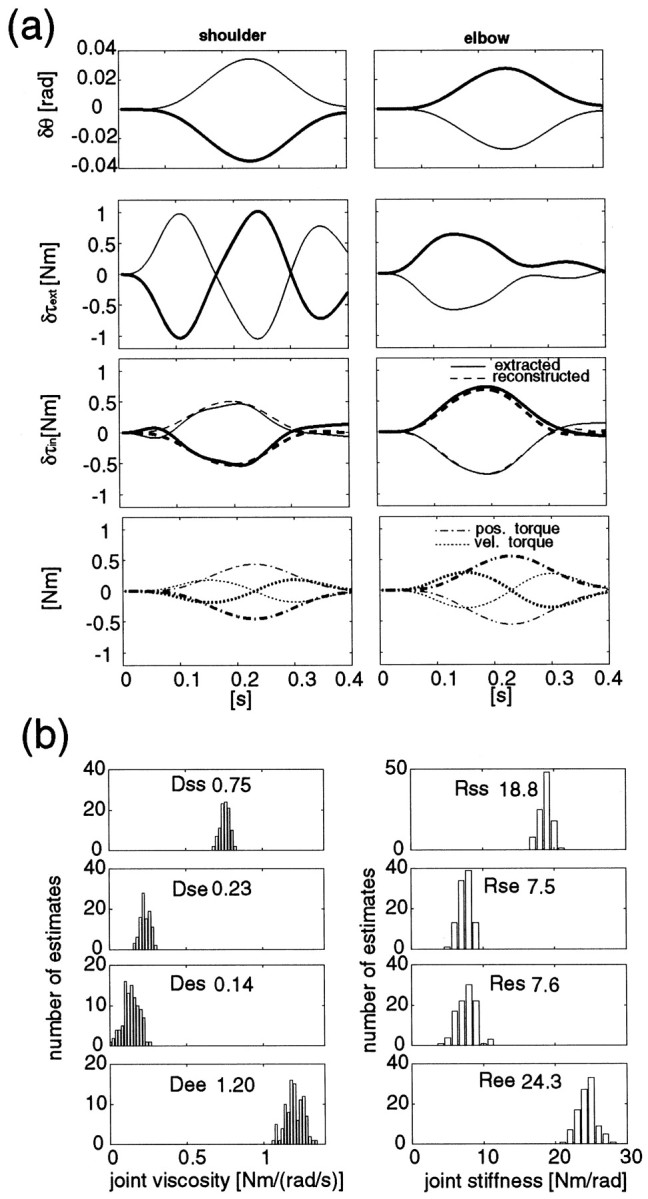
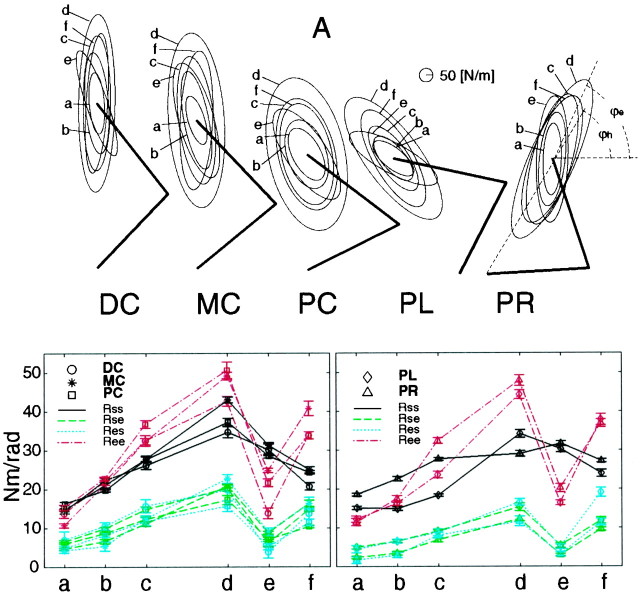
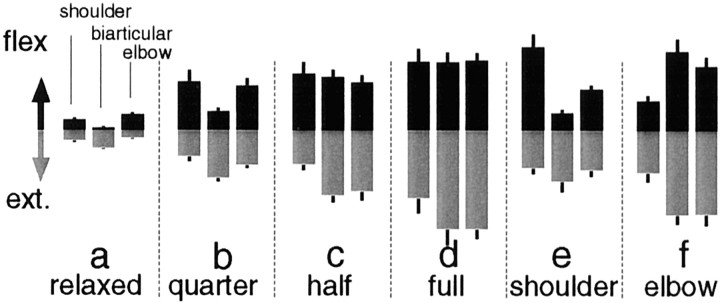
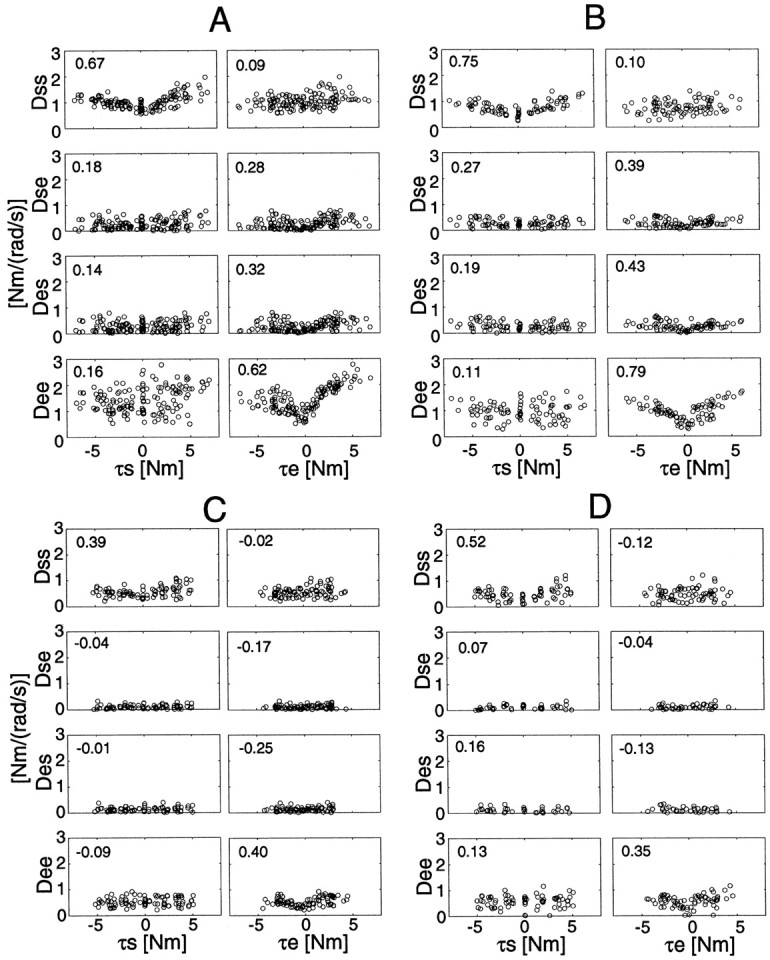
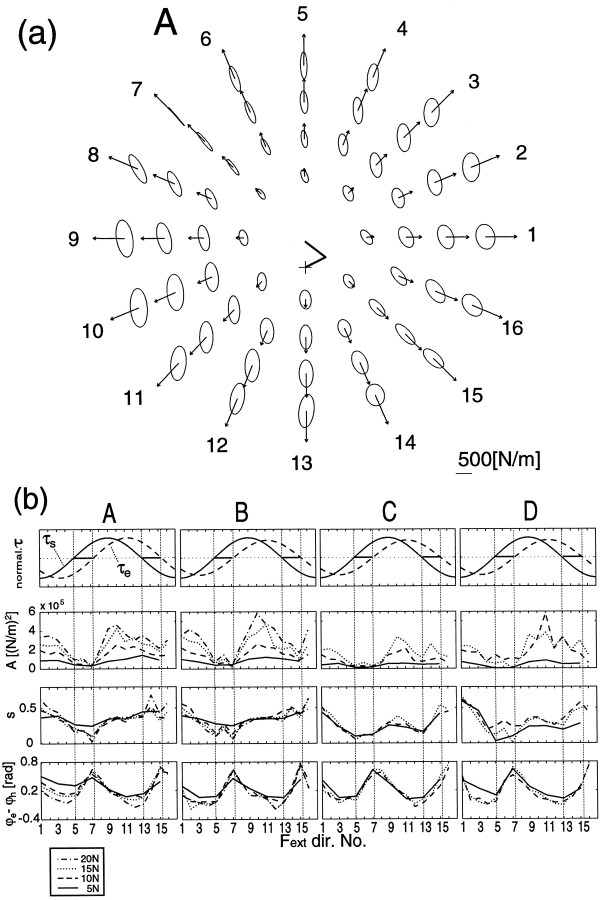
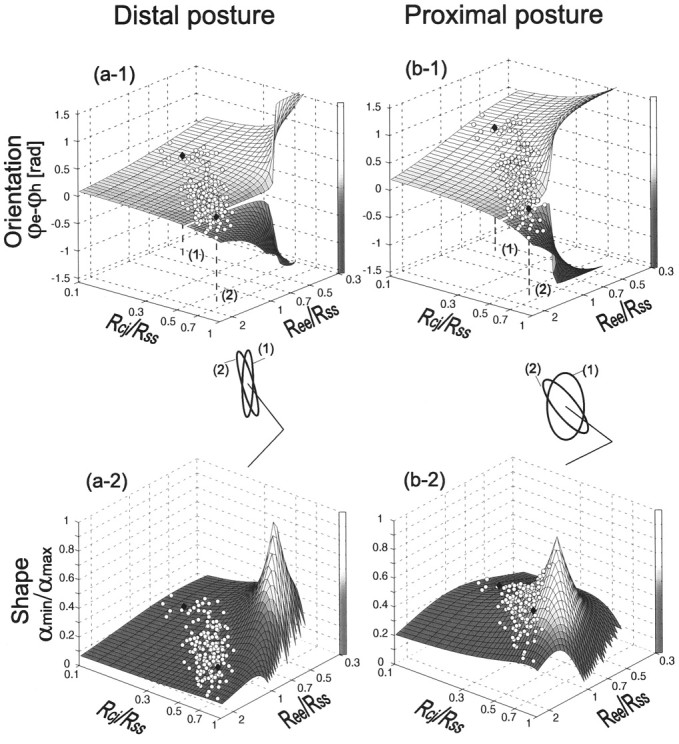
Human arm viscoelasticity is important in stabilizing posture, movement, and in interacting with objects. Viscoelastic spatial characteristics are usually indexed by the size, shape, and orientation of a hand stiffness ellipse. It is well known that arm posture is a dominant factor in determining the properties of the stiffness ellipse. However, it is still unclear how much joint stiffness can change under different conditions, and the effects of that change on the spatial characteristics of hand stiffness are poorly examined. To investigate the dexterous control mechanisms of the human arm, we studied the controllability and spatial characteristics of viscoelastic properties of human multijoint arm during different cocontractions and force interactions in various directions and amplitudes in a horizontal plane. We found that different cocontraction ratios between shoulder and elbow joints can produce changes in the shape and orientation of the stiffness ellipse, especially at proximal hand positions. During force regulation tasks we found that shoulder and elbow single-joint stiffness was each roughly proportional to the torque of its own joint, and cross-joint stiffness was correlated with elbow torque. Similar tendencies were also found in the viscosity-torque relationships. As a result of the joint stiffness changes, the orientation and shape of the stiffness ellipses varied during force regulation tasks as well. Based on these observations, we consider why we can change the ellipse characteristics especially in the proximal posture. The present results suggest that humans control directional characteristics of hand stiffness by changing joint stiffness to achieve various interactions with objects.


Figures

Fig. 1.
Fig. 1.
The PFM system and the experimental setup for measuring human arm mechanical impedance. The x-axis indicates the rightward direction, and the y-axis indicates the frontal direction away from the body. The origin for both axes is the shoulder position. The force vector in the horizontal plane was displayed on the computer monitor. To maintain the muscle activation level throughout each experimental set, the EMG (rectified and averaged) levels of six muscles were shown by a bar graph.
Fig. 2.
Fig. 2.
a, Positional shifts and variational torques at the shoulder and elbow joints caused by perturbations in opposite directions (thick andthin lines for each perturbation) during a force regulation task (subject B, 10 N, x-direction). Fromtop to bottom, δθ, δτext,Dδ +Rδq (solid line, observed;dashed line, reconstructed), and bothDδ (dotted lines) and Rδq(dash-dot lines) at the shoulder (left graphs) and elbow (right graphs) are shown. b, The estimated distribution functions of viscosity and stiffness parameters obtained by random sampling (100 times) from experimental data (see Materials and Methods). The number attached in each graph is the mean value of the estimates for each parameter.
Fig. 3.
Fig. 3.
Stiffness ellipses (top figures) and corresponding joint stiffness values (bottom figures) of subject A during posture maintenance tasks (af) in five different postures (DC, distal center; MC, middle center;PC, proximal center; PL, proximal left;PR, proximal right). Each ellipse represents the stiffness during the requested task indexed by a roman character: (a) without cocontraction, (b) with quarter cocontraction, (c) half cocontraction, (d) full cocontraction, (e) cocontraction only in the shoulder, and (f) cocontraction only in the elbow. The thick line represents the arm configuration in each posture. The bottom graphsrepresent the stiffness values (Rss,solid black line; Rse,dashed green line; Res,dotted blue line; Ree,dash-dot red line) during each task (af) at the hand positions [theleft graph is for DC (circle), MC (star), and PC (square); the right graph is for PL (diamond) and PR (triangle)]. The error bars represent the SD of estimates.
Fig. 4.
Fig. 4.
The magnitudes of rectified and averaged surface electromyograms (EMG level) from six muscles (shoulder monoarticular flexor and extensor muscles, biarticular flexor and extensor muscles, and elbow monoarticular flexor and extensor muscles) of subject A during posture maintenance tasks (af) in the middle center posture. The EMG levels were normalized in these tasks by the maximum EMG level for each individual muscle. The EMG levels of flexor muscles are depicted as black bars in the top portion of each graph, and the EMG levels of extensor muscles are depicted as gray bars in the bottom portion of each graph. Error bar on each bar graph represents SD of 24 trials of the corresponding EMG level.
Fig. 5.
Fig. 5.
Stiffness ellipses of subjects B,C, and D during posture maintenance tasks in three postures (DC, MC,PC). See Figure 3 caption for notation.
Fig. 6.
Fig. 6.
a, Joint stiffness values (Rss, Rse,Res, Ree) during force regulation tasks without cocontraction (instruction) at a proximal hand position (subject A). The stick picture in the center of the a shows the arm configuration (+ denotes shoulder position). Bar graphs were aligned in a polar manner according to force directions and magnitude (Fig. 10,arrows). The eight bar graph sets placed in the innermost circle represent the stiffness values during force regulation tasks at 5 N in the eight directions. Similarly, 16 bar graphs placed on the second, third, and fourth circular positions from center to outside represent those during force regulation tasks at 10, 15, and 20 N in each direction, respectively. The error bar on each bar represents SD of the corresponding estimate. b, Changes in joint torque and joint stiffness values according to the force directions of all four subjects. In the top row,solid and dashed lines represent shoulder and elbow normalized joint torque, respectively. In the second to fourth rows, lines represent each stiffness component (Rss, shoulder; Ree, elbow; Rcj = (Rse +Res)/2, cross-joint) during force regulation tasks with 5 (solid line), 10 (dashed line), 15 (dotted line), and 20 N (dash-dot line). The numbers on the abscissa denote the force directions applied to the handle (see also Fig. 10a).
Fig. 7.
Fig. 7.
a, The magnitudes of rectified and averaged surface electromyograms (EMG level) from six muscles (shoulder monoarticular flexor and extensor muscles, biarticular flexor and extensor muscles, and elbow monoarticular flexor and extensor muscles) during force regulation tasks in 16 directions without cocontraction (instructed) at the proximal hand position (subject A). The magnitudes of EMG were normalized by the maximum EMG value for each muscle within these tasks. The EMG results of flexor muscles are depicted as theblack bars in the top portion of each graph, and the EMG results of extensor muscles are depicted as thegray bars in the bottom portion of each graph. Error bar on each bar graphrepresents SD of 24 trials of the corresponding EMG level. The manner of graph arrangement is the same as in Figure 6a.b, Changes in joint torque and EMG levels of six muscles for all four subjects according to force direction. The top row shows the normalized torque. The second rowshows the normalized EMG levels of the shoulder monoarticular flexor (upper side) and extensor (lower side) muscles. Thethird and fourth rows show the normalized EMG levels of the elbow monoarticular and the biarticular muscles, respectively, in the same manner as the second row.
Fig. 8.
Fig. 8.
Joint torque and joint stiffness relationships during all force regulation tasks without cocontraction at the all hand positions. Each correlation coefficient between absolute torque and stiffness is placed in the top left corner of each graph.
Fig. 9.
Fig. 9.
Joint torque and joint viscosity relationships during all force regulation tasks without cocontraction at the all hand positions. Each correlation coefficient between absolute torque and viscosity is placed in the top left corner in each graph.
Fig. 10.
Fig. 10.
a, Stiffness ellipses during force regulation tasks without cocontraction at the proximal center hand position (subject A). Each ellipse represents the spatial characteristics of the elastic property of the arm at the corresponding hand position. All ellipses are aligned in a polar manner according to the force directions and magnitudes requested in each task. The ellipses placed in the innermost circle represent the hand stiffness during force regulation tasks at 5 N in eight directions. Similarly, 16 ellipses placed in the second, third, and fourth circle positions represent those during force regulation tasks at 10, 15, and 20 N in each direction, respectively. The arrow on each ellipse denotes the force magnitude and direction. The stick picture in the center of the polar graphs shows the arm configuration of each subject.b, The characteristics of the stiffness ellipses (sizeA, shape s, and orientation ϕe–ϕh) of all subjects during force regulation tasks without cocontraction at the proximal center hand position. Thetop graphs represent the normalized torque at the shoulder and elbow. In the second, third, and fourth graphs, solid,dashed, dotted, anddash-dot lines denote each index (see ordinate label) during force regulation tasks at 5, 10, 15, 20 N, respectively. The force regulation tasks at 20 N were not applied to subjects C and D. The numbers on the abscissa denote the force directions applied to the handle.
Fig. 11.
Fig. 11.
The theoretical (surface) and experimental (open circles) variations of orientation (ϕe–ϕh; top graphs) and shape (s; bottom graphs) of the stiffness ellipse at a distal ([x, y] = [0.0, 0.5]m; left graphs) and proximal ([0.0, 0.35]m; right graphs) postures according to the change in stiffness ratios (Ree/Rse,Rcj/Rss). In thetop graphs, the surface representing theoretical variation of orientation split away at 0 rad, indicating that the major axis of ellipse is in the hand–shoulder direction. Experimental data points (open circles) on the surfaces were derived from Equations 5 and 6 with the stiffness ratios of subject A, realized in all tasks. The ellipses for two sets of stiffness ratios (indicated on the bottom axes plane of top figures) are depicted for distal and proximal postures. Each ellipse size is normalized by the major axis of the ellipse. Their orientations and shapes are indicated by filled diamonds on the corresponding surfaces.

Similar articles

Cited by

References

    1. Agarwal GC, Gottlieb GL. Compliance of the human ankle joint. Trans ASME J Biomech Eng. 1977;99:166–170.
    1. Bennett DJ, Hollerbach JM, Xu Y, Hunter IW. Time-varying stiffness of human elbow joint during cyclic voluntary movement. Exp Brain Res. 1992;88:433–442. - PubMed
    1. Bizzi E, Hogan N, Mussa-Ivaldi FA, Giszter S. Does the nervous system use equilibrium-point control to guide single and multiple joint movements? Behav Brain Sci. 1992;15:603–613. - PubMed
    1. Dolan JM, Friedman MB, Nagurka ML. Dynamic and loaded impedance components in the maintenance of human arm posture. IEEE Trans Syst Man Cybern. 1993;23:698–709.
    1. Fetz EE, Cheney PD. Postspike facilitation of forelimb muscle activity by primate corticomotoneuronal cells. J Neurophysiol. 1980;44:751–772. - PubMed