. 1998 Nov 1;18(21):9099-111.
doi: 10.1523/JNEUROSCI.18-21-09099.1998.

Spike-and-wave oscillations based on the properties of GABAB receptors

Affiliations

Spike-and-wave oscillations based on the properties of GABAB receptors

A Destexhe. J Neurosci. .

Abstract

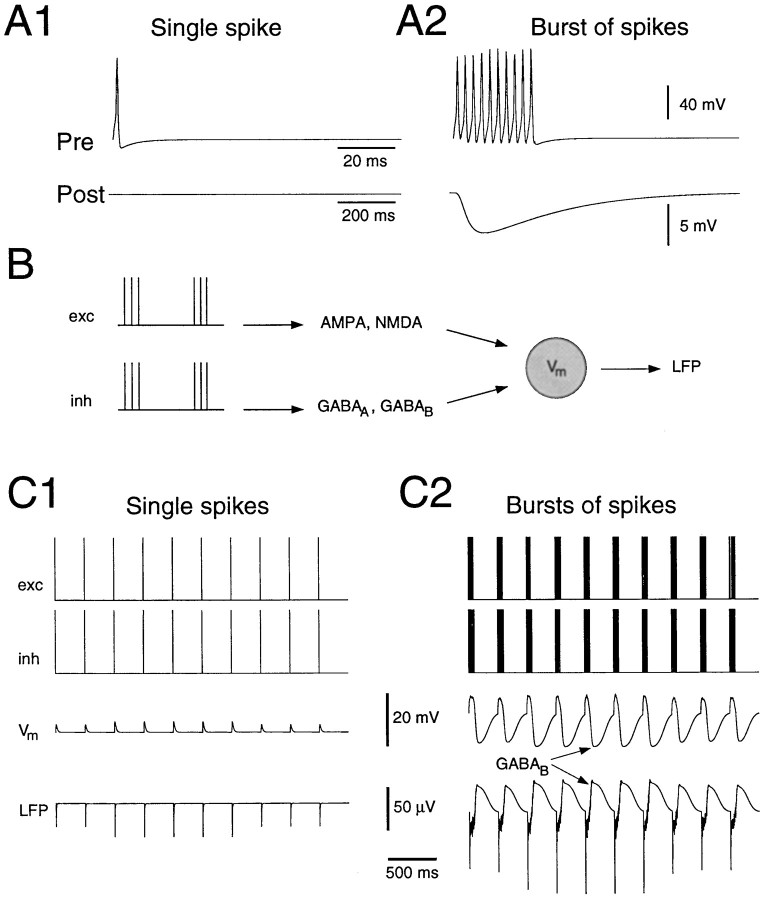
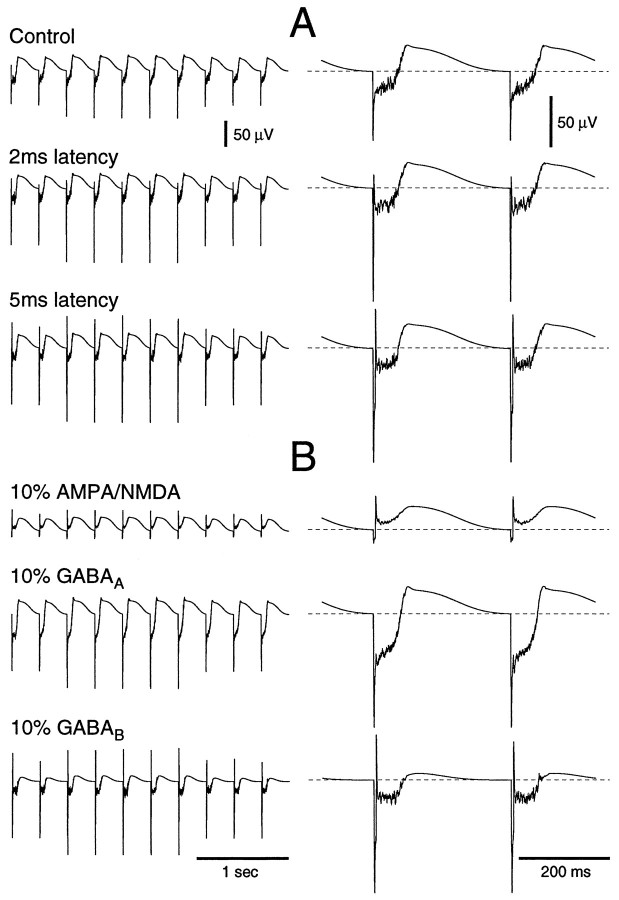
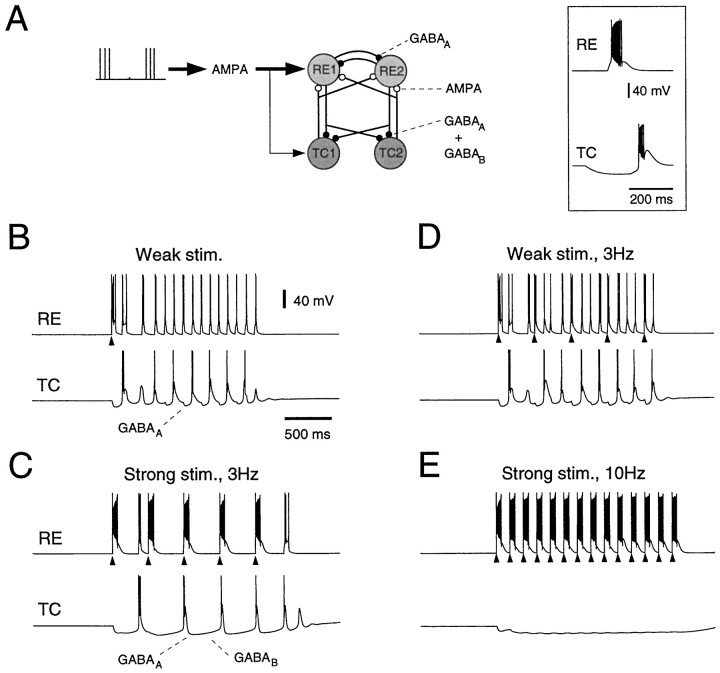
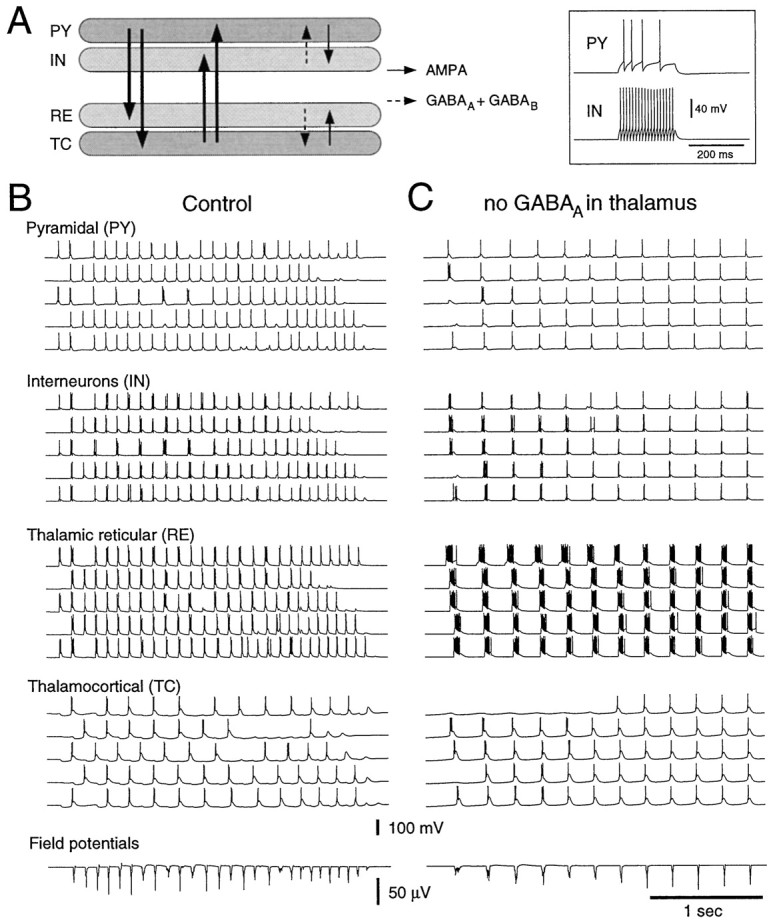
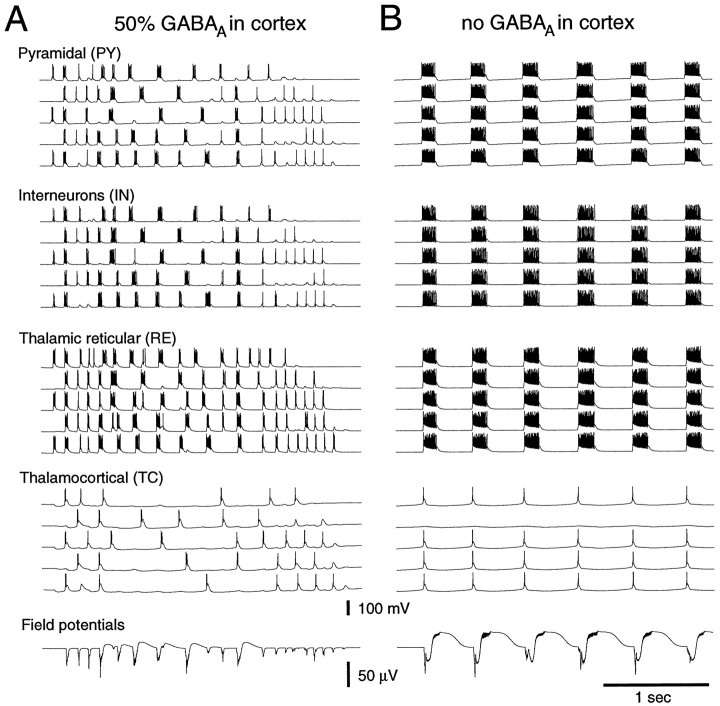
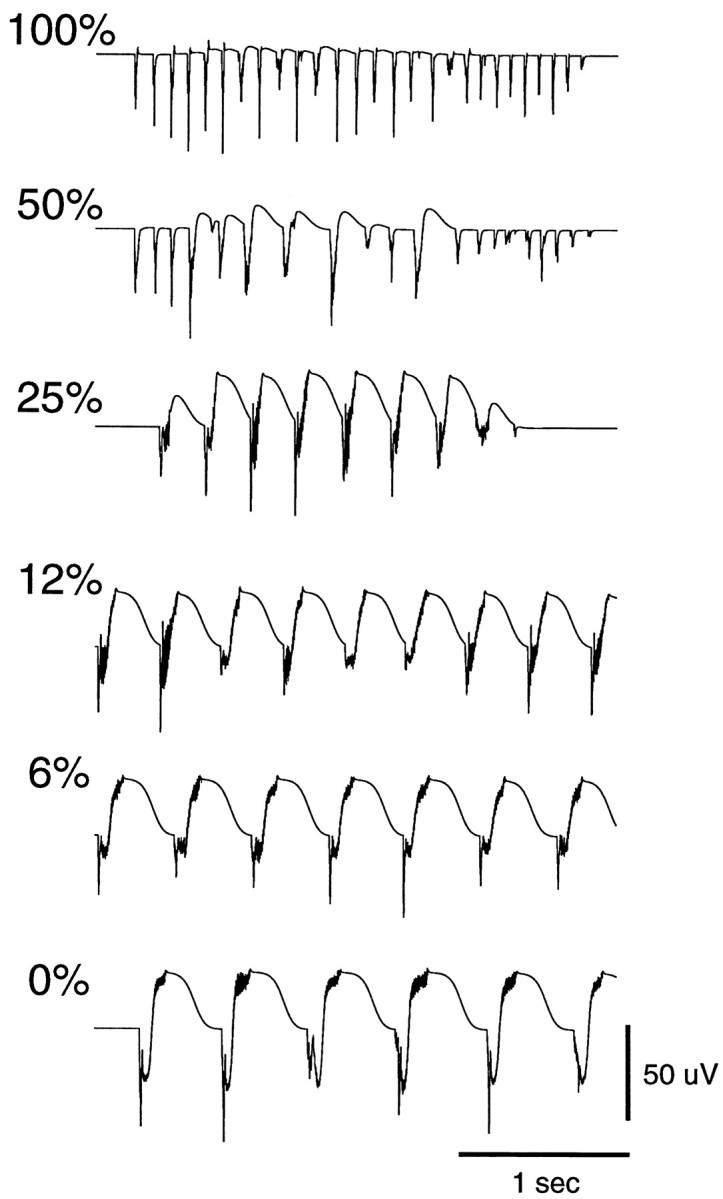
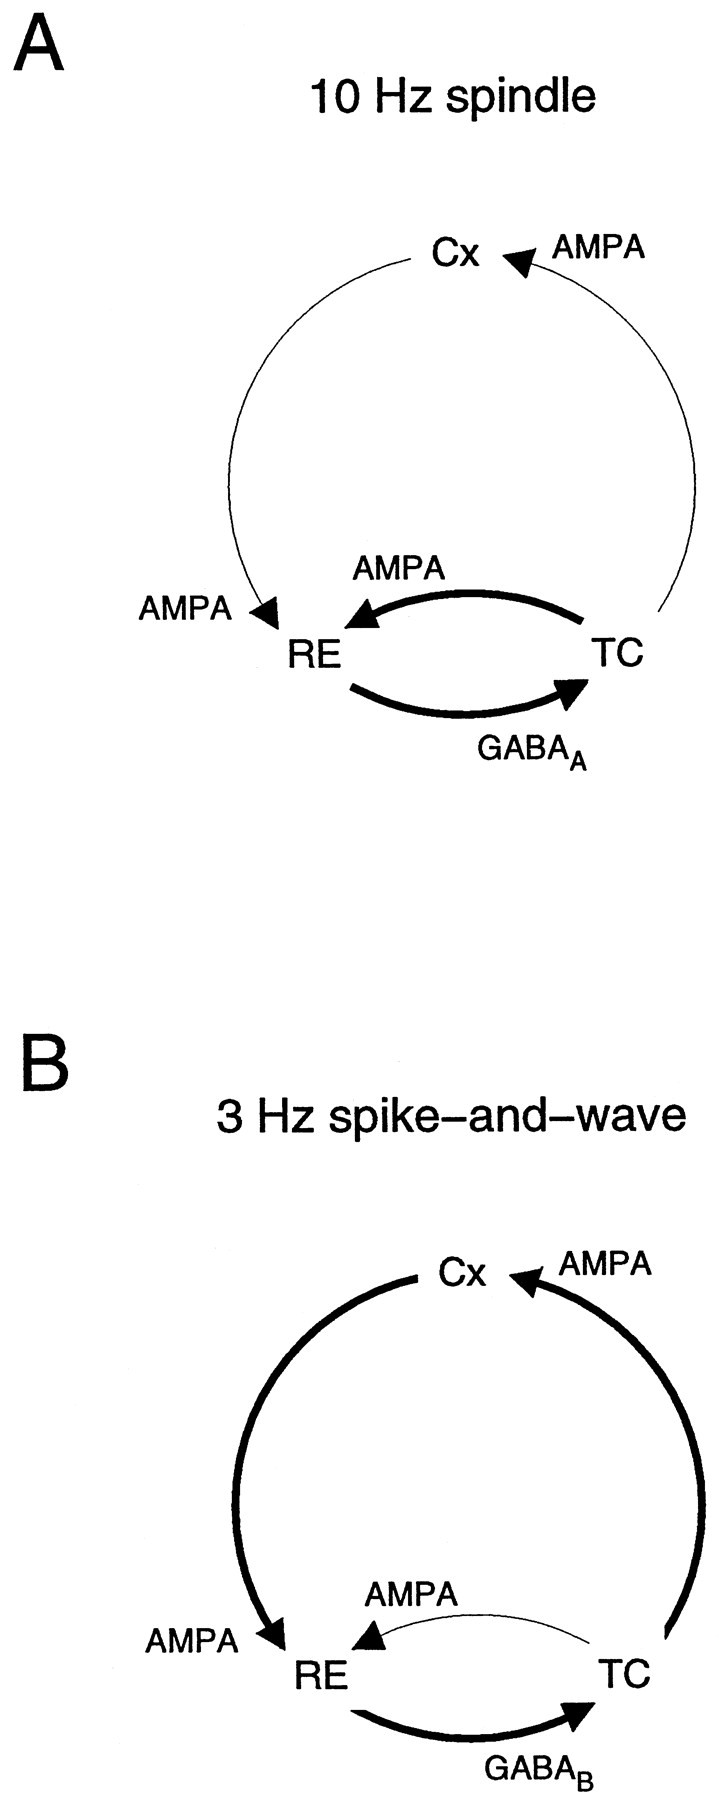
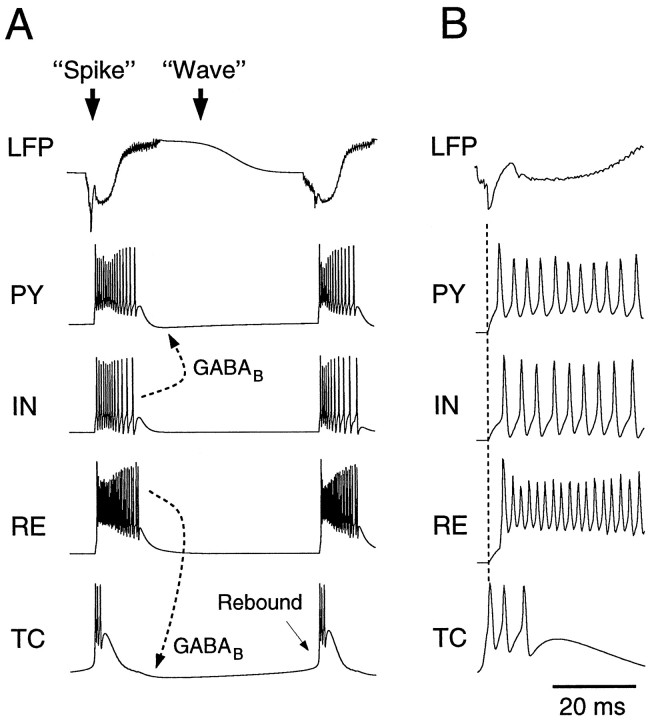
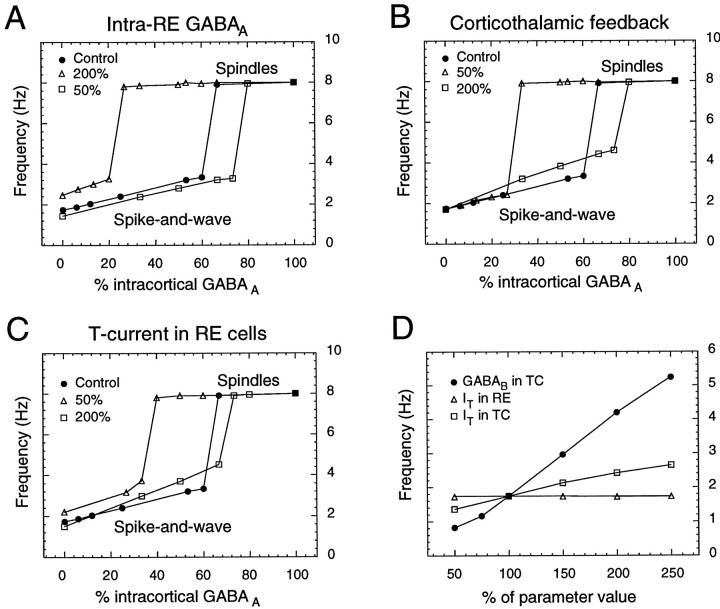
Neocortical and thalamic neurons are involved in the genesis of generalized spike-and-wave (SW) epileptic seizures. The cellular mechanism of SW involves complex interactions between intrinsic neuronal firing properties and multiple types of synaptic receptors, but because of the complexity of these interactions the exact details of this mechanism are unclear. In this paper these types of interactions were investigated by using biophysical models of thalamic and cortical neurons. It is shown first that, because of the particular activation properties of GABAB receptor-mediated responses, simulated field potentials can display SW waveforms if cortical pyramidal cells and interneurons generate prolonged discharges in synchrony, without any other assumptions. Here the "spike" component coincided with the synchronous firing, whereas the "wave" component was generated mostly by slow GABAB-mediated K+ currents. Second, the model suggests that intact thalamic circuits can be forced into a approximately 3 Hz oscillatory mode by corticothalamic feedback. Here again, this property was attributable to the characteristics of GABAB-mediated inhibition. Third, in the thalamocortical system this property can lead to generalized approximately 3 Hz oscillations with SW field potentials. The oscillation consisted of a synchronous prolonged firing in all cell types, interleaved with a approximately 300 msec period of neuronal silence, similar to experimental observations during SW seizures. This model suggests that SW oscillations can arise from thalamocortical loops in which the corticothalamic feedback indirectly evokes GABAB-mediated inhibition in the thalamus. This mechanism is shown to be consistent with a number of different experimental models, and experiments are suggested to test its consistency.


Figures

Fig. 1.
Fig. 1.
Simulation of spike and wave in field potentials, based on the properties of GABAB receptors.A, Nonlinear activation properties of GABABreceptors. If the binding of four G-proteins is needed to activate the K+ channels associated with GABABreceptors, then GABAB-mediated inhibitory responses are dependent on the number of presynaptic action potentials.A1, With a single presynaptic spike no GABABresponse was detectable. A2, A burst of presynaptic spikes led to sufficient accumulation of G-proteins to generate the slow IPSP. B, Scheme for the model of local field potentials. Excitatory and inhibitory presynaptic trains of action potentials were generated to stimulate various postsynaptic receptor types (AMPA, NMDA, GABAA, and GABAB). One hundred synapses of each type were simulated, and the synaptic currents were integrated into a single compartment model and used to calculate the extracellular field potential at a distance of 5 μm from the simulated neuron.C, Field potentials generated by single spikes and bursts of spikes. With single spikes (C1) the mixed EPSP/IPSP sequence led to negative deflections in the field potentials. With bursts of spikes (C2) the fast spiky components alternate with slow positive deflections, similar to spike-and-wave patterns. These slow positive waves are attributable to the activation of GABAB-mediated currents (arrows). Conductance values are 4, 1, 1.5, and 4 nS for individual AMPA, NMDA, GABAA, and GABAB synapses, respectively.
Fig. 2.
Fig. 2.
Factors determining the morphology of simulated spike-and-wave complexes. A, Effect of a latency between the firing of excitatory and inhibitory synapses.Control, Simulation is identical to Figure1C2. If excitatory synapses discharged earlier than inhibitory synapses (2 and 5 msec latency), the spike component was enhanced. B, Effect of synaptic receptor types. The5 msec latency simulation from A was repeated here with different values for synaptic conductances. A 90% reduction of AMPA/NMDA conductances (top trace), GABAA conductances (middle trace), or GABAB conductances (bottom trace) affected the morphology of the SW patterns. The right columnshows the last complexes at higher resolution.
Fig. 3.
Fig. 3.
Corticothalamic feedback can force thalamic circuits into ∼3 Hz oscillations because of the properties of GABAB receptors. A, Scheme of connectivity and receptor types in a circuit of thalamocortical (TC) and thalamic reticular (RE) neurons. Corticothalamic feedback was simulated through AMPA-mediated synaptic inputs (shown on the left of the connectivity diagram; total conductance was 1.2 μS to RE cells and 0.01 μS to TC cells). Theinset shows simulated burst responses of TC and RE cells after current injection (pulse of 0.3 nA during 10 msec for RE and −0.1 nA during 200 msec for TC). B, A single stimulation of corticothalamic feedback (arrowhead) entrained the circuit into a 10 Hz mode similar to that for spindle oscillations. C, With a strong-intensity stimulation at 3 Hz (arrowheads; 14 spikes per stimulus), RE cells were recruited into large bursts, which evoked IPSPs onto TC cells dominated by GABAB-mediated inhibition. In this case the circuit could be entrained into a different oscillatory mode, with all cells firing in synchrony. D, Weak stimulation at 3 Hz (arrowheads) entrained the circuit into spindle oscillations (identical intensity as in B).E, Strong stimulation at 10 Hz (arrowheads) led to quiescent TC cells because of sustained GABAB current (identical intensity as inC).
Fig. 4.
Fig. 4.
Transformation of spindle oscillations into ∼4 Hz oscillations by blocking thalamic inhibition in thalamocortical networks. A, Scheme of the connectivity among different cell types: 100 cells of each type were simulated, including thalamocortical (TC) and thalamic reticular (RE) cells, cortical pyramidal cells (PY), and interneurons (IN). The connectivity is shown bycontinuous arrows, representing AMPA-mediated excitation, and dashed arrows, representing mixed GABAA and GABAB inhibition. In addition, PY cells were interconnected by using AMPA receptors, and RE cells were interconnected by using GABAA receptors. Theinset shows the repetitive firing properties of PY and IN cells that follow depolarizing current injection (0.75 nA during 200 msec; −70 mV rest). B, Spindle oscillations in the thalamocortical network in control conditions. Five cells of each type, equally spaced in the network, are shown (0.5 msec time resolution). The field potentials, consisting of successive negative deflections at ∼10 Hz, are shown at the bottom. C, Oscillations after the suppression of GABAA-mediated inhibition in thalamic cells with cortical inhibition intact (all GABAA conductances postsynaptic to RE cells were suppressed). The network generated synchronized oscillations at ∼4 Hz, with thalamic cells displaying prolonged discharges. PY cells showed discharge patterns similar to those of spindles but at a slower frequency; so did the field potentials (bottom).
Fig. 5.
Fig. 5.
Transformation of spindle oscillations into ∼3 Hz oscillations with spike-and-wave field potentials by reducing cortical inhibition. Shown is a similar arrangement of traces as in Figure 4, B and C. A, Oscillations with a 50% decrease of GABAA-mediated inhibition in cortical cells (0.075 μS, IN→PY). Stronger burst discharges appeared within spindle oscillations, leading to large-amplitude negative spikes, followed by small positive waves in the field potentials (bottom). B, Oscillations after suppression of GABAA-mediated inhibition in cortical cells. All cells displayed prolonged discharges in phase, separated by long periods of silences, at a frequency of ∼2 Hz. GABAB currents were activated maximally in TC and PY cells during the periods of silence. Field potentials (bottom) displayed spike-and-wave complexes. Thalamic inhibition was intact inA and B.
Fig. 6.
Fig. 6.
Gradual transformation of spindles to spike-and-wave complexes. The field potentials obtained for different simulations similar to Figure 5 are shown from top tobottom. The different simulations correspond to identical conditions, except that intracortical GABAA-mediated inhibition (IN→PY) was reduced, with total conductance values of 0.15 μS (100%), 0.075 μS (50%), 0.0375 μS (25%), 0.018 μS (12%), and 0.009 μS (6%). 100%corresponded to a spindle sequence (same simulation as in Fig.4B) and 0% to fully developed SW complexes when the intracortical GABAA inhibition was suppressed (same simulation as in Fig. 5B); intrathalamic inhibition was intact in all cases.
Fig. 7.
Fig. 7.
Thalamocortical loop mechanism for spike and wave. Simplified diagrams represent the major steps involved in generating oscillations (Cx, cortex). A, Spindle oscillations resulting from a mutual recruitment of thalamic TC and RE cells (thick lines) in which TC cells rebound after fast GABAA-mediated IPSPs, setting the frequency to ∼10 Hz. Here, the oscillation is generated in the thalamus and is reinforced by the thalamocortical loop (thin lines). B, Proposed mechanism for spike and wave. In this case the corticothalamic feedback is much stronger because of increased cortical excitability, forcing thalamic cells to display prolonged burst discharges, which evoke GABAB-mediated IPSPs in TC cells. This prolonged inhibition prevents cells from firing during ∼300 msec and sets the frequency to ∼3 Hz.
Fig. 8.
Fig. 8.
Phase relations during simulated spike-and-wave discharges. A, Local field potentials (LFP) and representative cells of each type during SW oscillations. Spike, All cells displayed prolonged discharges in synchrony, leading to spiky field potentials.Wave, The prolonged discharge of RE andIN neurons evoked maximal GABAB-mediated IPSPs in TC and PY cells, respectively (dashed arrows), stopping the firing of all neuron types during a period of 300–500 msec and generating a slow positive wave in the field potentials. The next cycle restarted because of the rebound of TC cells after the GABAB IPSP (arrow). B, Phase relationships in the thalamocortical model. TC cells discharged first, followed by PY, RE, and INcells. The initial negative peak in the field potentials coincided with the first spike in TC cells before the PYcells started firing and was generated by thalamic EPSPs inPY cells.
Fig. 9.
Fig. 9.
Determinants of spike-and-wave oscillations. A, Effect of GABAA-mediated inhibition between RE cells. The lowest frequency of SW complexes is represented as a function of the amount of GABAA inhibition in cortex (simulations similar to Fig. 6). In control (filled circles) the frequency of SW increased steadily up to 60% of cortical GABAA; then a transition occurred to spindle oscillations (lowest frequency of ∼8 Hz). With twice smaller intra-RE GABAA conductances (open squares) this transition occurred at ∼75% cortical GABAA. When intra-RE GABAAconductances were doubled, the domain of SW was significantly smaller, with a transition occurring at ∼20% of cortical GABAA(open triangles). B, Effect of corticothalamic feedback on RE cells. With diminished AMPA conductance in PY→RE synapses (50% of control value), the domain of SW was reduced significantly (open triangles), whereas reinforced cortical EPSPs had the opposite effect (open squares). Filled circles, Same control as inA. C, Effect of the T-current conductance in RE cells. With reinforced T-current (200% of control value) the transition occurred at ∼75% of cortical GABAA(open squares), whereas with diminished T-current (50% of control value) the domain of SW was reduced significantly (open triangles). Filled circles, Same control as in A. D, Determinants of SW frequency. The frequency of SW bursts in the simulation of Figure5B was represented when several parameters were varied. These parameters are represented as the percentage of their control value (100% = control). The parameters represented are the decay of intrathalamic GABAB currents (filled circles), the T-current conductance in TC (open squares), and RE cells (open triangles).

Similar articles

Cited by

References

    1. Avoli M, Gloor P. The effect of transient functional depression of the thalamus on spindles and bilateral synchronous epileptic discharges of feline generalized penicillin epilepsy. Epilepsia. 1981;22:443–452. - PubMed
    1. Avoli M, Gloor P. Role of the thalamus in generalized penicillin epilepsy: observations on decorticated cats. Exp Neurol. 1982;77:386–402. - PubMed
    1. Avoli M, Gloor P, Kostopoulos G, Gotman J. An analysis of penicillin-induced generalized spike and wave discharges using simultaneous recordings of cortical and thalamic single neurons. J Neurophysiol. 1983;50:819–837. - PubMed
    1. Burke W, Sefton AJ. Inhibitory mechanisms in lateral geniculate nucleus of rat. J Physiol (Lond) 1966;187:231–246. - PMC - PubMed
    1. Buzsáki G, Smith A, Berger S, Fisher LJ, Gage FH. Petit mal epilepsy and parkinsonian tremor: hypothesis of a common pacemaker. Neuroscience. 1990;36:1–14. - PubMed

Publication types

LinkOut - more resources