

Climate forcings in the industrial era
- PMID: 9788985
- PMCID: PMC33912
- DOI: 10.1073/pnas.95.22.12753
Climate forcings in the industrial era
Abstract
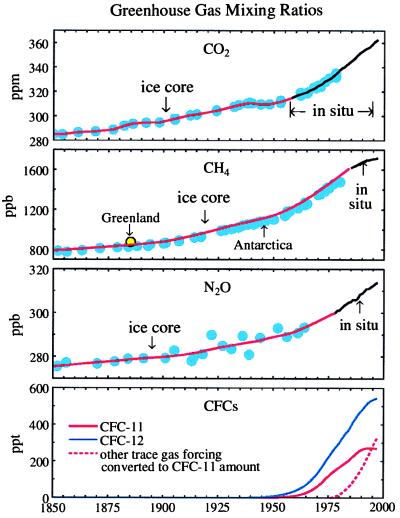
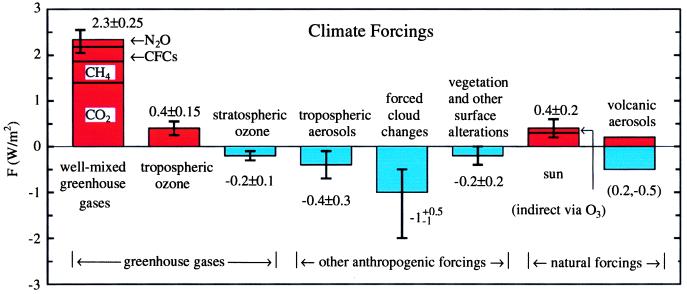
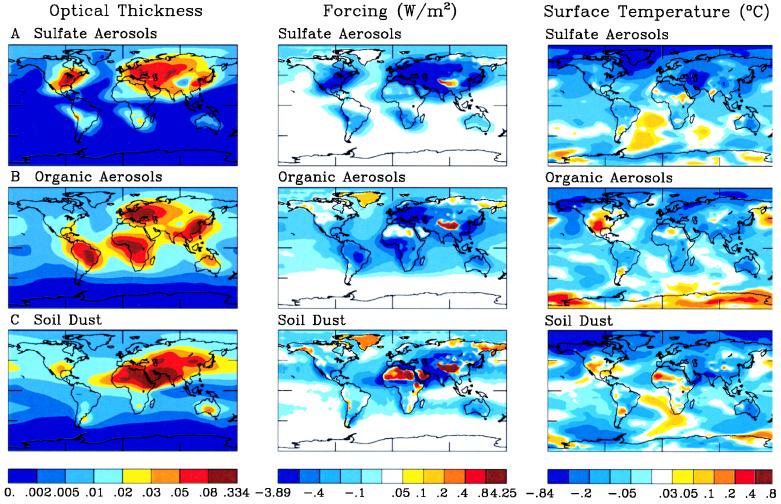
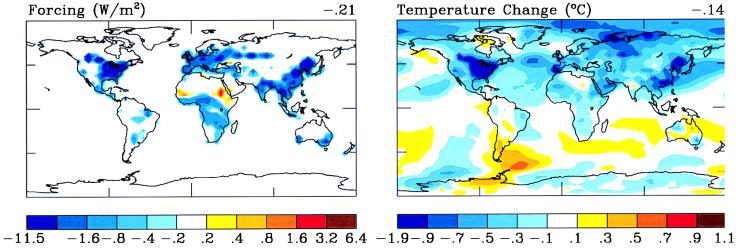
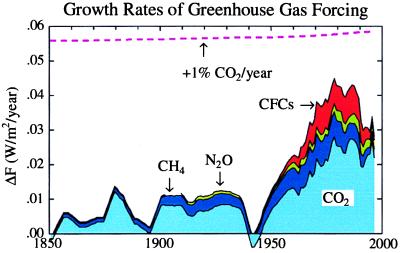
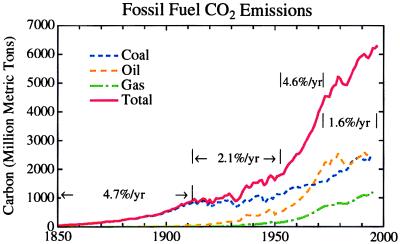
The forcings that drive long-term climate change are not known with an accuracy sufficient to define future climate change. Anthropogenic greenhouse gases (GHGs), which are well measured, cause a strong positive (warming) forcing. But other, poorly measured, anthropogenic forcings, especially changes of atmospheric aerosols, clouds, and land-use patterns, cause a negative forcing that tends to offset greenhouse warming. One consequence of this partial balance is that the natural forcing due to solar irradiance changes may play a larger role in long-term climate change than inferred from comparison with GHGs alone. Current trends in GHG climate forcings are smaller than in popular "business as usual" or 1% per year CO2 growth scenarios. The summary implication is a paradigm change for long-term climate projections: uncertainties in climate forcings have supplanted global climate sensitivity as the predominant issue.
Figures
References
-
- Hansen J, Sato M, Ruedy R. J Geophys Res. 1997;102:6831–6864.
-
- Houghton J T, Meira Filho L G, Callander B A, Harris N, Kattenberg A, Maskell K, editors. Intergovernmental Panel on Climate Change. Climate Change (1995) Univ. Press, Cambridge, U.K.: Cambridge; 1996.
-
- Hansen J, Sato M, Lacis A, Ruedy R. Philos Trans R Soc London B. 1997;352:231–240.
-
- Lorenz E N. J Atmos Sci. 1963;20:130–141.
-
- Lorius C, Jouzel J, Raynaud D, Hansen J, Le Treut H. Nature (London) 1990;347:139–145.
Publication types
MeSH terms
Substances
LinkOut - more resources
Full Text Sources
