. 1998 Oct 27;95(22):13165-70.
doi: 10.1073/pnas.95.22.13165.

Interaction affinity between cytokine receptor components on the cell surface

Affiliations

Interaction affinity between cytokine receptor components on the cell surface

A Whitty et al. Proc Natl Acad Sci U S A. .

Abstract

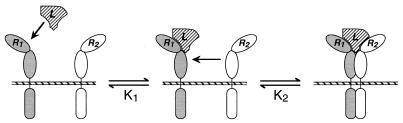
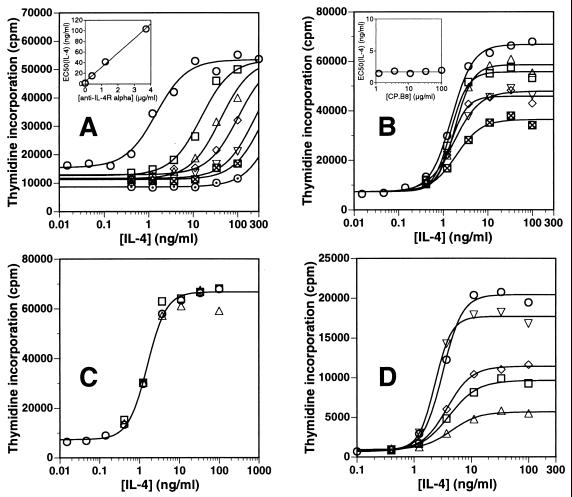
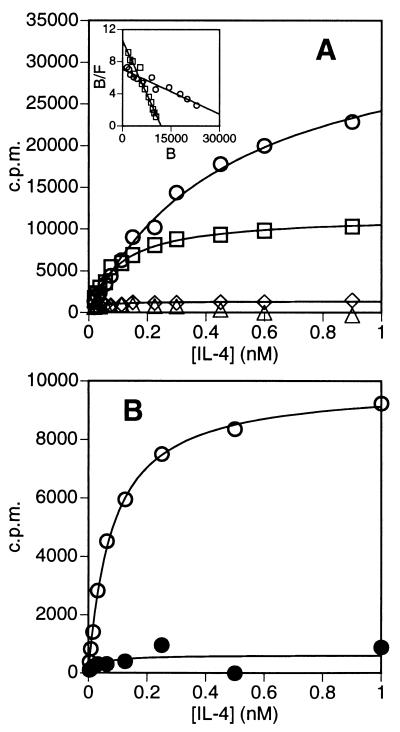
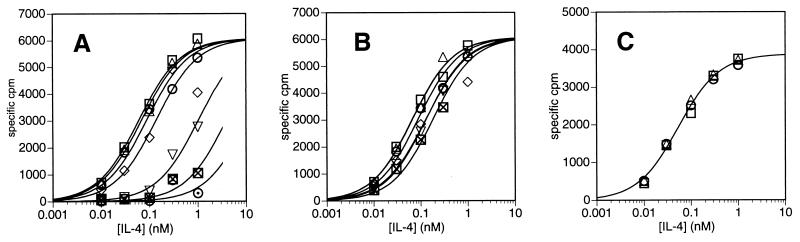
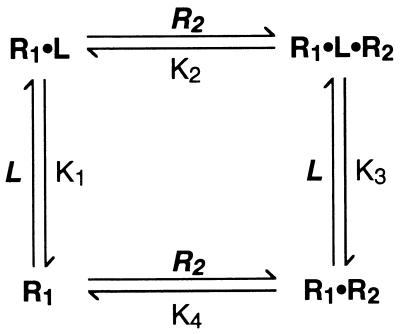
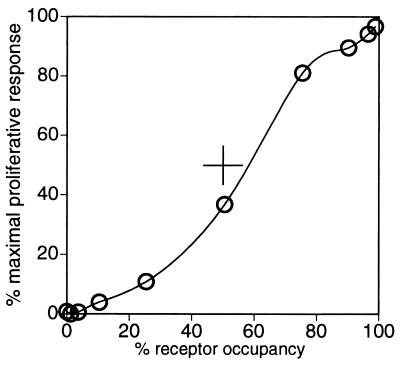
The anti-common gamma chain (gammac) mAb CP.B8 is shown to inhibit interleukin 4 (IL-4)-dependent proliferation of phytohemagglutinin (PHA) activated T cells noncompetitively with respect to cytokine by blocking the IL-4-induced heterodimerization of IL-4Ralpha and gammac receptor chains. Affinities for the binding of IL-4 to Cos-7 cells transfected with huIL-4Ralpha, and to PHA blasts expressing both IL-4Ralpha and gammac, were used to estimate the affinity of the key interaction between gammac and the binary IL-4Ralpha.IL-4 complex on the cell surface. This affinity was defined in terms of the dimensionless ratio [IL-4Ralpha.IL-4.gammac]/[IL-4Ralpha.IL-4], which we designate KR. The results show that on PHA blasts this interaction is relatively weak; KR approximately 9, implying that approximately 10% of the limiting IL-4Ralpha chain remains free of gammac even at saturating concentrations of IL-4. This quantitative treatment establishes KR as a key measure of the coupling between ligand binding and receptor activation, providing a basis for functional distinctions between different receptors that are activated by ligand-induced receptor dimerization.


Figures

Figure 1
Figure 1
Schematic representation of the ligand-induced receptor dimerization mechanism as it applies to class I cytokine receptors (3, 4). In the case of the IL-4 receptor, R1 is the IL-4Rα chain and R2 is γc. For homodimeric receptors such as hGH-R, R1 and R2 are identical.
Figure 2
Figure 2
Overlaid dose-response curves for the IL-4-dependent proliferation of PHA-activated T cells measured at various fixed concentrations of (A) blocking anti-IL-4Rα mAb at 0 (○) 0.41 (□), 1.23 (▵), 3.7 (◊), 11.1 (▿), 33.3 (⊠), or 100 μg/ml (⊙); (B) anti-γc mAb CP.B8 at 0, (○), 1.23 (□), 3.7 (▵), 11.1 (◊), 33.3 (▿), or 100 μg/ml (⊠); (C) isotype controls MOPC 21 (mouse IgG1, for CP.B8) (□) and UPC10 (mouse IgG2a, for anti-IL-4Rα) (▵) at 100 μg/ml, or no mAb (○); or (D) anti-γc mAb CP.B8 at 0, (○), 100 (□), or 300 μg/ml (▵), MOPC 21 at 300 μg/ml (▿), or a CP.B8 Fab fragment at 100 μg/ml (◊). Data are represented as mean counts/min (cpm) determined from triplicate wells. The solid lines are best fits of the data to a standard four-parameter equation. (Inset A) EC50 for IL-4 increases linearly with anti-IL-4Rα mAb concentration. (Inset B) EC50 for IL-4 is independent of CP.B8 concentration.
Figure 3
Figure 3
Binding of 125I-labeled IL-4 (A) to Cos-7 cells transiently transfected with a pCDM8 vector containing the cDNA sequence for full-length huIL-4Rα (2 μg, ○), full-length human γc (20 μg, ◊), cotransfected with IL-4Rα (2 μg) plus γc (20 μg, □), or to mock-transfected cells (▵); or (B) to PHA-activated (○) or resting (•) PBMC. The data are plotted as the average of duplicate measurements after correction for nonspecific binding. Data are fitted to a simple hyperbolic equation representing a single site binding model. (Inset A) Data for IL-4 binding to cells transfected with IL-4Rα alone (○), or cotransfected with IL-4Rα plus γc (□), represented as Scatchard plots of bound/free 125I-IL-4 × 10⁻⁴ (B/F) versus bound 125I-IL-4 (B, in cpm).
Figure 4
Figure 4
Binding of 125I-labeled IL-4 to PHA-activated PBMC in the presence of various fixed concentrations of (A) blocking anti-IL-4Rα mAb at 0 (○) 0.01 (□), 0.1 (▵), 1.0 (◊), 10 (▿), 100 (⊠), or 1,000 ng/ml (⊙); (B) anti-γc mAb CP.B8 at 0, (○), 0.01 (□), 0.1 (▵), 1.0 (◊), 10 (▿), or 100 μg/ml (⊠); or (C) isotype controls MOPC 21 (for CP.B8, □) and UPC10 (for anti-IL-4Rα, ▵) at 100 μg/ml, or no mAb (○). Data are fitted to a simple hyperbolic binding curve.
Scheme 1
Scheme 1
Figure 5
Figure 5
IL-4-dependent proliferation of PHA-activated T cells (as % maximal 3H-thymidine incorporation) over a range of IL-4 concentrations, plotted as a function of the fractional occupancy of the receptor at each concentration of IL-4. Proliferation data were taken from the zero mAb data set in Fig. 2B. Receptor occupancy at each IL-4 concentration was calculated by using KD(App) = 60 pM for the binding of 125I-IL-4 to PHA-activated PBMC (see Fig. 3B and text). The solid line is an arbitrary interpolation of the data points.

References

    1. Heldin C-H. Cell. 1995;80:213–223. - PubMed
    1. Ulrich A, Schlessinger J. Cell. 1990;61:203–212. - PubMed
    1. Cunningham B C, Ultsch M, De Vos A M, Mulkerrin M G, Clauser K R, Wells J A. Science. 1991;254:821–825. - PubMed
    1. Fuh G, Cunningham B C, Fukunaga R, Nagata S, Goeddel D V, Wells J A. Science. 1992;256:1677–1680. - PubMed
    1. Stahl N, Yancopoulos G D. Cell. 1993;74:587–590. - PubMed

LinkOut - more resources