. 1998 Oct 27;95(22):13260-5.
doi: 10.1073/pnas.95.22.13260.

Patch-clamp and amperometric recordings from norepinephrine transporters: channel activity and voltage-dependent uptake

Affiliations

Patch-clamp and amperometric recordings from norepinephrine transporters: channel activity and voltage-dependent uptake

A Galli et al. Proc Natl Acad Sci U S A. .

Abstract

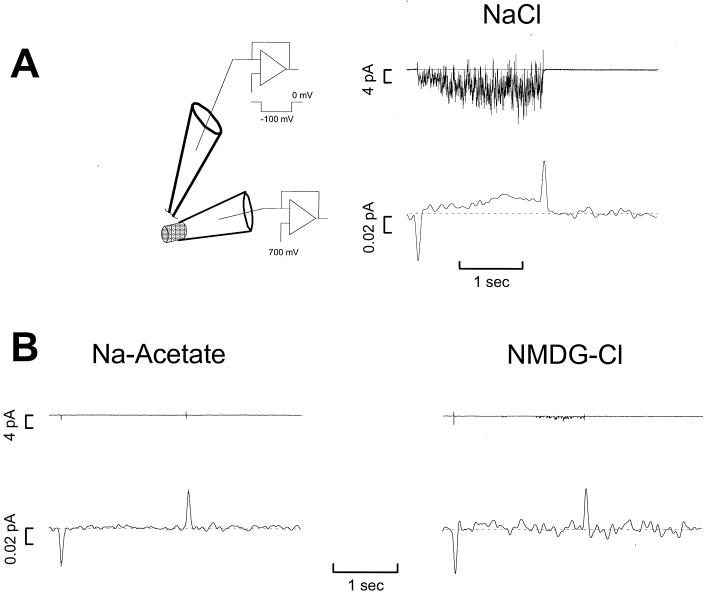
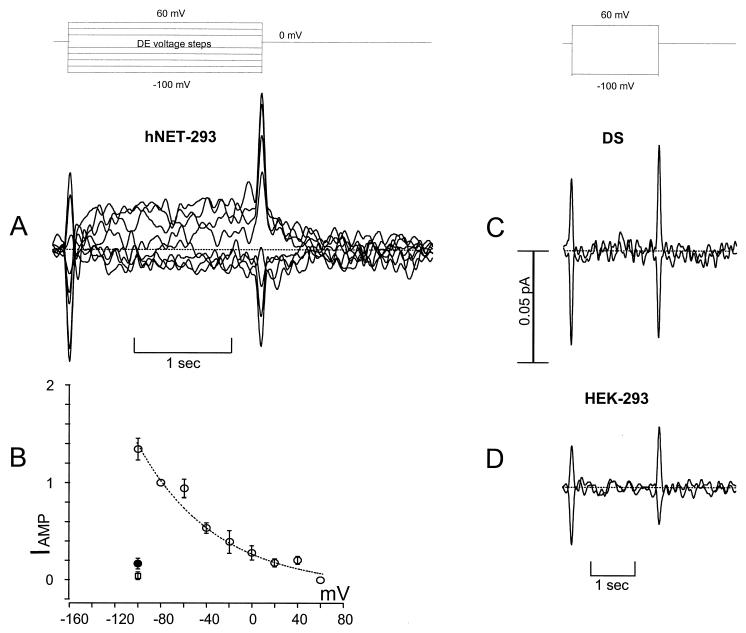
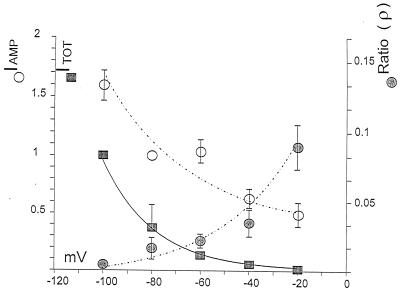
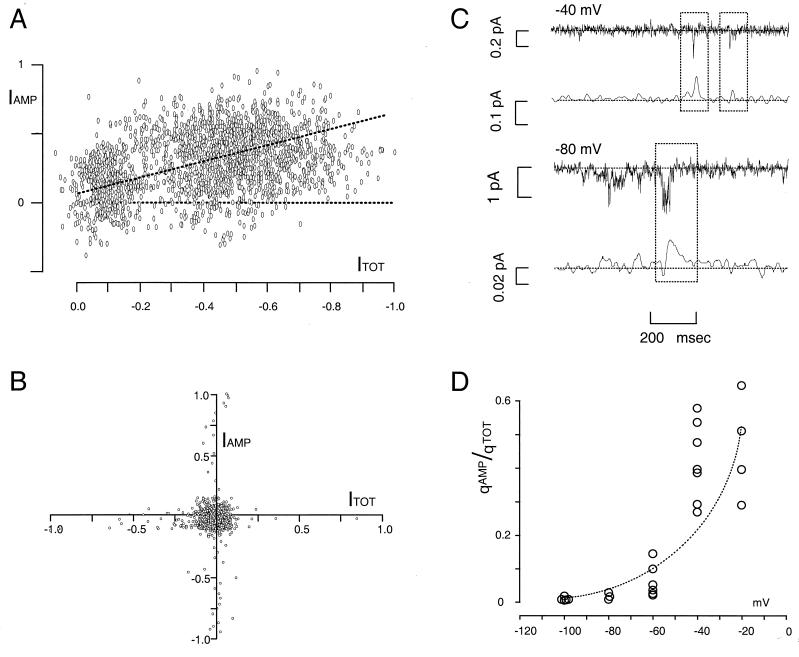
Transporters for the biogenic amines dopamine, norepinephrine, epinephrine and serotonin are largely responsible for transmitter inactivation after release. They also serve as high-affinity targets for a number of clinically relevant psychoactive agents, including antidepressants, cocaine, and amphetamines. Despite their prominent role in neurotransmitter inactivation and drug responses, we lack a clear understanding of the permeation pathway or regulation mechanisms at the single transporter level. The resolution of radiotracer-based flux techniques limits the opportunities to dissect these problems. Here we combine patch-clamp recording techniques with microamperometry to record the transporter-mediated flux of norepinephrine across isolated membrane patches. These data reveal voltage-dependent norepinephrine flux that correlates temporally with antidepressant-sensitive transporter currents in the same patch. Furthermore, we resolve unitary flux events linked with bursts of transporter channel openings. These findings indicate that norepinephrine transporters are capable of transporting neurotransmitter across the membrane in discrete shots containing hundreds of molecules. Amperometry is used widely to study neurotransmitter distribution and kinetics in the nervous system and to detect transmitter release during vesicular exocytosis. Of interest regarding the present application is the use of amperometry on inside-out patches with synchronous recording of flux and current. Thus, our results further demonstrate a powerful method to assess transporter function and regulation.


Figures

Figure 1
Figure 1
A (left) is a diagram of the experimental setup. The top electrode forms an inside-out patch from hNET-transfected HEK-293 cells that is voltage clamped to 0 mV for 4 sec and to −100 mV for 2 sec. The bottom amperometric electrode holds a carbon fiber held +700 mV. All experiments were done at 37°C. A (right) shows typical recordings from a patch electrode (containing an external-like solution plus 4 mM NE) and an amperometric electrode. B (left) shows an experiment similar to A except that the patch pipette contains Na acetate in place of NaCl. The response in the patch and in the amperometric electrode is null. B (right) shows an experiment similar to A except that N-methyl-d-glucamine replaces Na as the major cation in the pipette. From these experiments, the response in the amperometric electrode that correlates with the patch current depends on the presence of Cl and Na. To control for the possibility that the patches used in these controls may contain low numbers of transporters, we repeated this experiment with 14 patches without Cl and 11 patches without Na, with the same result.
Figure 2
Figure 2
A shows raw oxidative currents as a function of voltage. The amperometric traces were low-pass filtered at 5 Hz. A shows that hyperpolarizing steps induced positive amperometric currents. An upward (positive) deflection indicates NE oxidation and thus represents movement of NE out of the patch in the direction of “uptake.” At 0 mV there is uptake because depolarizing the patch caused a downward deflection (less NE being oxidized). The 0.05-pA scale applies to the entire figure; however, the 2-sec scale is expanded in A. Transient capacity current on the amperometric traces indicates the voltage step. The data points and bars indicate average ± SEM. B shows the steady-state amperometric current plotted against the patch-test voltage. The level of NE uptake indicated by the oxidative current increases at negative voltages without saturation in the range studied. In contrast, NE uptake saturates at positive voltages, and at 60 mV there was further deflection, consistent with previous data on voltage-dependent uptake. We therefore defined NE uptake (open circles) as the amperometric current at a particular voltage minus the current at 60 mV. To comparecells, data(n = 5) are represented as the fraction of theamperometric current arbitrarily normalized at−80 mV. The dotted line represents a Marquardt nonlinear, least squares polynomial fit. Adding 12 μM DS to the bath at the maximal current re-duced NE uptake close to zero (filled circle, n = 4). We obtained a similar result with parental HEK-293 cells (open square, n = 13). C shows the effect of 12 μM DS added to the bath on amperometric currents recorded in hNET-293 cells at +60 and −100 mV (same cell as A; 4 mM NE in the patch pipette). D shows similar raw traces from patches removed from HEK-293 cells and clamped to +60 and −100 mV, with normal extracellular solution plus 4 mM NE in the pipette. The 4 mM NE response was blocked by 12 μM DS or 4 μM nisoxetine (n = 3) (data not shown), a more potent inhibitor of hNET.
Figure 3
Figure 3
The filled squares represent the average NE-induced current during 2-sec voltage steps (4 mM in the pipette, as in Fig. 1A). We define NE-induced current as the current during a protocol minus the unblocked current after adding 8–12 μM DS to the bath (n = 3). Data points and bars indicate average ± SEM. The open circles represent the average amperometric current during 2-sec voltage steps; we obtained these values by subtracting the average current at +60 mV from the current at each potential. To separate the two curves, we normalized the filled squares at −100 mV and the open circles at −80 mV. The filled circles are the ratio (ρ) of the average amperometric current to the DS-sensitive patch current. This ratio shows that the percentage of the current carried by NE increases with potential. By using z = 3 to convert IAMP into NE molecules, the oxidation products during the 2-sec pulse, at −20 mV, NE carries more than nearly 10% of the NE-induced current. Although uptake increases at negative voltages (open circles), ρ values decrease because more total charge is translocated.
Figure 4
Figure 4
A illustrates the correlation between NE-induced current through the patch and the NE released from the same patch (4 mM NE in the pipette; compare with raw data in Fig. 1). The illustrated data are from a patch stepped from 0 to −100 mV, and the plot is the normalized time-varying NE-induced current (ITOT) against normalized time-varying NE-uptake (IAMP). Both traces were low-pass filtered at 50 Hz. The slope of the point dispersion was evaluated by using the sample Pearson product moment (R). At −100 mV, where we record the strongest amperometric current, R = 0.58 (slanted dotted line). The flat line indicates zero correlation. B illustrates the time relation between patch and amperometric currents from a parental cell patch with 4 mM NE in the pipette; in these cases, R was zero in 13 experiments. Controls on transfected cells with no NE in the pipette or with 4 mM NE in the pipette but 12 μM DS or 4 μM nisoxetine in the bath gave similar negative results. C shows isolated NE-induced, DS-sensitive current events at −40 and −80 mV and simultaneous recordings from the amperometric electrode. The dotted rectangles focus attention on typical pairs selected for analysis. D shows the ratio (γ) of the amperometric charge, qAMP, to the corresponding patch-current charge, qTOT (data from seven different patches) as a function of patch voltage.
Figure 5
Figure 5
Schematic of hNET carrier (alternating-access) and channel modes. The alternating access model assumes that a state transition for NE permeation (AB) results in the transport of a single NE molecule. The channel mode (C) is a low probability event that requires NE, Na, and Cl for activation. The amperometric spikes consist of hundreds of NE molecules crossing the membrane coupled with other ions down their electrochemical gradients.

Comment in

  • Neurotransmitter transport: models in flux.
    Kavanaugh MP. Kavanaugh MP. Proc Natl Acad Sci U S A. 1998 Oct 27;95(22):12737-8. doi: 10.1073/pnas.95.22.12737. Proc Natl Acad Sci U S A. 1998. PMID: 9788979 Free PMC article. Review. No abstract available.

Similar articles

Cited by

References

    1. Trendelenburg T. Trends Pharmacol Sci. 1991;12:334–337. - PubMed
    1. Giros B, Caron M G. Trends Pharmacol Sci. 1993;14:43–49. - PubMed
    1. Amara S, Kuhar M J. Annu Rev Neurosci. 1993;16:73–93. - PubMed
    1. Blakely R D, DeFelice L J, Hartzell H C. J Exp Biol. 1994;196:263–281. - PubMed
    1. Lester H A, Mager S, Quick M W, Corey J L. Annu Rev Pharmacol Toxicol. 1994;34:219–249. - PubMed

Publication types

LinkOut - more resources