. 1998 Nov;180(21):5601-11.
doi: 10.1128/JB.180.21.5601-5611.1998.

Gigantism in a bacterium, Epulopiscium fishelsoni, correlates with complex patterns in arrangement, quantity, and segregation of DNA

Affiliations

Gigantism in a bacterium, Epulopiscium fishelsoni, correlates with complex patterns in arrangement, quantity, and segregation of DNA

V Bresler et al. J Bacteriol. 1998 Nov.

Abstract

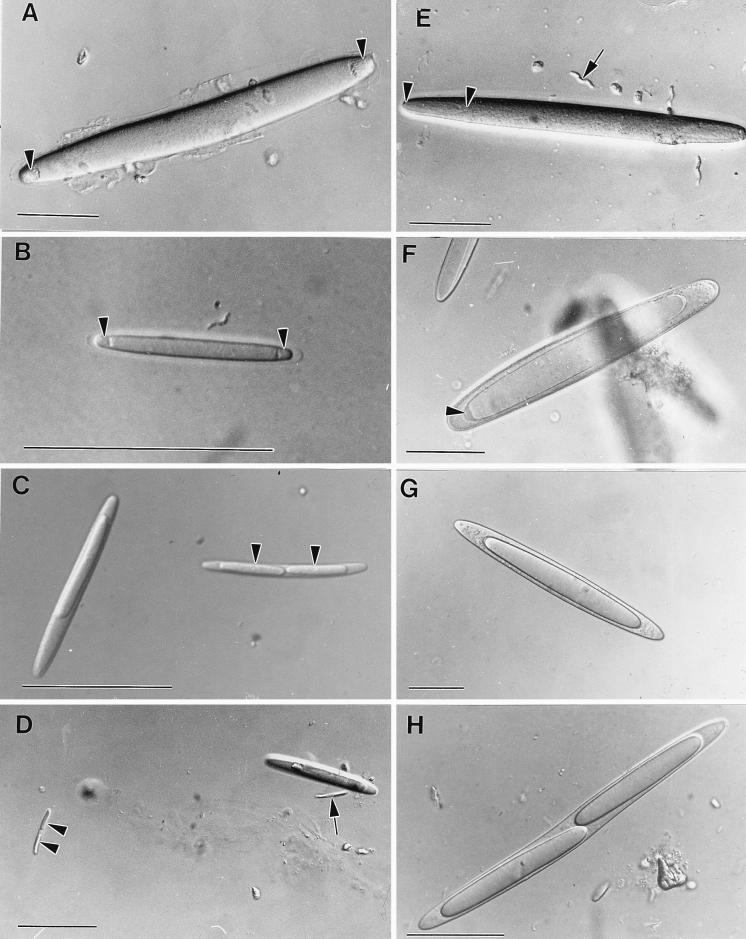
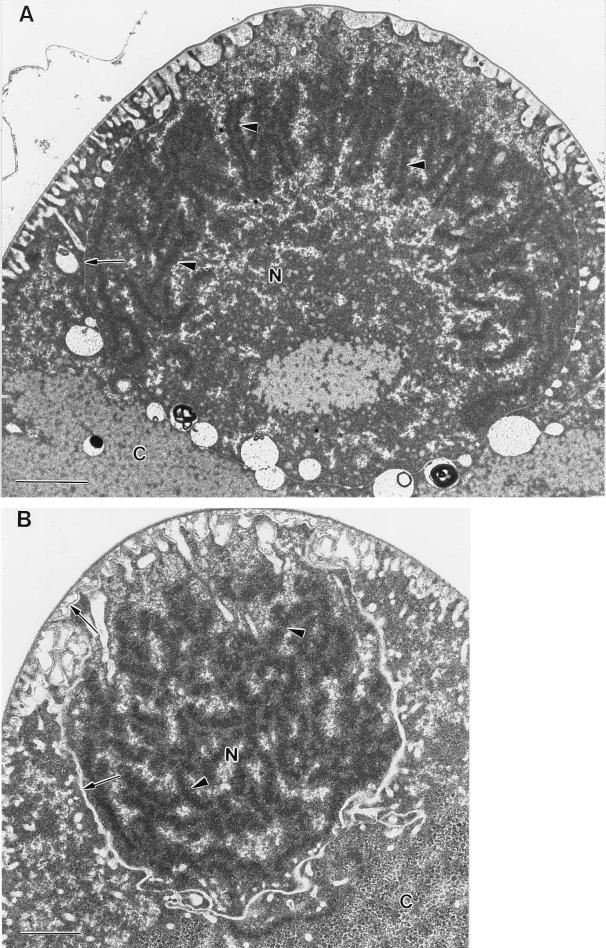
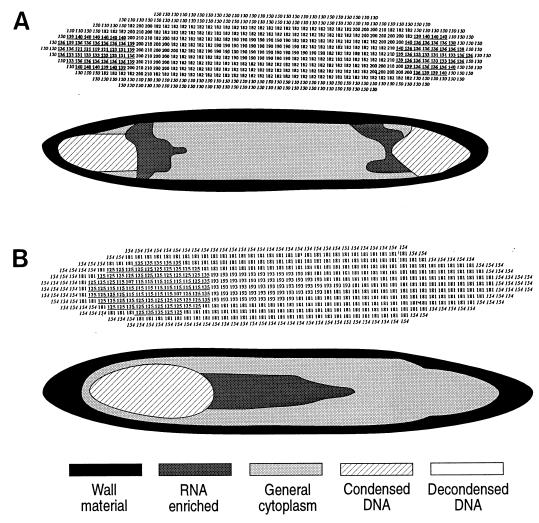
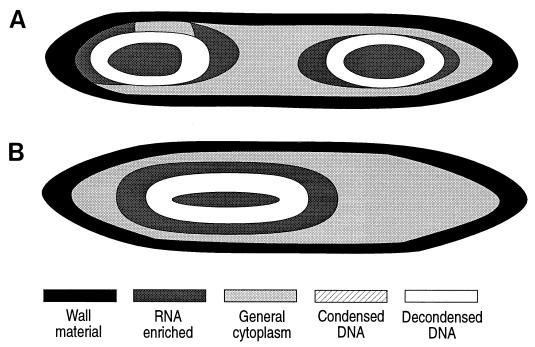
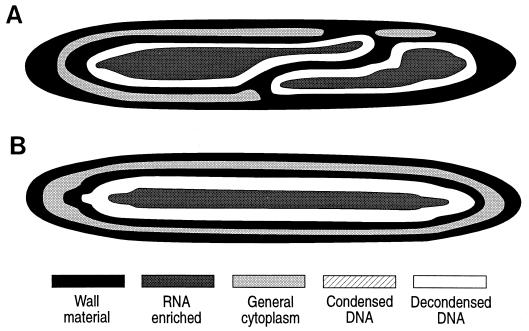
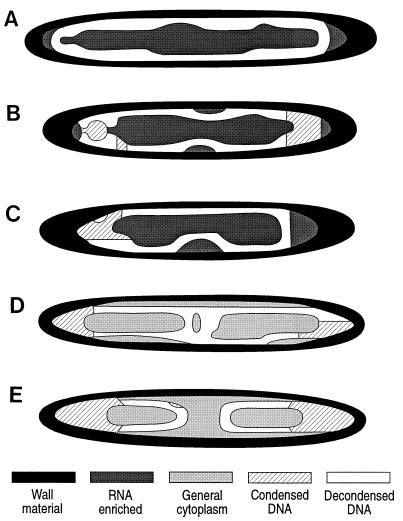
Epulopiscium fishelsoni, gut symbiont of the brown surgeonfish (Acanthurus nigrofuscus) in the Red Sea, attains a larger size than any other eubacterium, varies 10- to 20-fold in length (and >2, 000-fold in volume), and undergoes a complex daily life cycle. In early morning, nucleoids contain highly condensed DNA in elongate, chromosome-like structures which are physically separated from the general cytoplasm. Cell division involves production of two (rarely three) nucleoids within a cell, deposition of cell walls around expanded nucleoids, and emergence of daughter cells from the parent cell. Fluorescence measurements of DNA, RNA, and other cell components indicate the following. DNA quantity is proportional to cell volume over cell lengths of approximately 30 micrometers to >500 micrometers. For cells of a given size, nucleoids of cells with two nucleoids (binucleoid) contain approximately equal amounts of DNA. And each nucleoid of a binucleoid cell contains one-half the DNA of the single nucleoid in a uninucleoid cell of the same size. The life cycle involves approximately equal subdivision of DNA among daughter cells, formation of apical caps of condensed DNA from previously decondensed and diffusely distributed DNA, and "pinching" of DNA near the middle of the cell in the absence of new wall formation. Mechanisms underlying these patterns remain unclear, but formation of daughter nucleoids and cells occurs both during diurnal periods of host feeding and bacterial cell growth and during nocturnal periods of host inactivity when mean bacterial cell size declines.


Figures

FIG. 1
FIG. 1
Light micrographs of stages in the life cycle of E. fishelsoni taken under differential interference contrast illumination. Bars = 50 μm. (A) A 237-μm-long cell with two compact, apical nucleoids (arrowheads). The cell was collected at 0640 h. (B) A 45-μm binucleoid (arrowheads) cell collected at 0640 h. (C) Uninucleoid and binucleoid cells with expanded nucleoids. The larger cell is 60 μm long. Unlike larger cells, small nucleoids (arrowheads) of small binucleoid cells do not overlap within the parent cell. Cells were collected at 2000 h. (D) Very small binucleoid cells with nonoverlapping nucleoids (arrowheads). The smallest cell (arrow) is 23 μm long with nucleoids that are <10 μm long. The cells were collected at 2000 h. (E) A 216-μm binucleoid cell with oval nucleoids (between arrowheads). Note the presumed spirillum (arrow) with a length of ∼18 μm. Cells were collected at 0915 h. (F) A 195-μm-long uninucleoid cell exhibiting presumed “caps” (see text) of condensed DNA (arrowhead) at apices of maximally enlarged nucleoid. Cell was collected at 1640 h. (G) A 225-μm-long uninucleoid cell with optically distinct daughter cell found only in night samples (compare with Fig. 1F). Cell was collected at 2200 h. (H) A 184-μm-long binucleoid cell with optically distinct daughter cells. Cells were collected at 0130 h.
FIG. 2
FIG. 2
Transmission electron micrographs of compact nucleoids of E. fishelsoni collected at 0800 h. Note presumptive condensed DNA in chromosome-like bodies (arrowheads), delicate cross-striations on some of these bodies, and separation of nucleoidal material from remaining cytoplasm by structures (arrows) continuous with similar materials below the cell wall at the tip of the cell. Bars = 1 μm. (A) Cell fixed in 2% glutaraldehyde–0.05 M cacodylate in filtered seawater. (B) Cell fixed in 2% glutaraldehyde–0.25 M sucrose–0.05 M cacodylate in distilled water.
FIG. 3
FIG. 3
Digital images and graphical representation of the same images for binucleoid (A) and uninucleoid (B) E. fishelsoni cells collected at 0800 h and containing compact nucleoids similar to those shown in Fig. 1A and B. Both cells measured ∼520 by 65 μm. Cells were stained with acridine orange as described in the text. Values in digital images are R/G fluorescence ratios. Numbers in italics are values consistent with glycoprotein of cell walls; bold and underlined numbers are values consistent with condensed DNA or condensed DNA plus RNA; remaining values are consistent with RNA-enriched cytoplasm, with higher values reflecting higher concentrations of RNA. For visual clarity, ranges of values were identified for condensed DNA, decondensed DNA, general cytoplasm, RNA-enriched cytoplasm, and cell wall materials. Values were then replaced by distinctive shading or hatching patterns, and the edges were smoothed to more closely represent cell configuration. Subsequent figures present only the graphical images; copies of the original digital images are available from the authors and are posted on W. L. Montgomery’s web site (http://www2.nau.edu/∼wlm). In some figures generated from digital images, cell wall material appears unusually thick along sides and, particularly, apices of cells. This is due to readings of thick optical sections along strongly curved portions of whole cells. More accurate representations of walls occur in electron micrographs (Fig. 2) (14, 23).
FIG. 4
FIG. 4
Binucleoid and uninucleoid E. fishelsoni collected at 1000 h. Dimensions: ∼320 by 45 μm (A) and ∼330 by 55 μm (B). Other features are as described in the legend for Fig. 3. Note expansion of nucleoids, their shift toward the center of the cells, the concentration of decondensed DNA along periphery of nucleoid, and the high concentration of RNA in core of nucleoids.
FIG. 5
FIG. 5
Formation of mature daughter cells in binucleoid and uninucleoid E. fishelsoni collected at 1640 h. Dimensions: ∼520 by 65 μm (A) and ∼530 by 65 μm (B). Other features are as described in the legend for Fig. 3. Note formation of presumptive cell wall material around nucleoids and the separation of this wall material from the parental wall by a thin layer of cytoplasm. Cells for this figure were collected at the same time as those shown in Fig. 6A through C, emphasizing that stages in the epulo life cycle are not precisely synchronized in time and between individual host fish.
FIG. 6
FIG. 6
Maturing daughter cells of E. fishelsoni collected at 1640 h (A through C) and 0430 h (D through E). Other features are as described in the legend to Fig. 3. (A) Daughter cell (∼390 by 45 μm) lacking caps and with decondensed DNA evenly dispersed below the cell wall. (B) Daughter cell (∼350 by 45 μm) with two caps. (C) Daughter cell (∼350 by 45 μm) with single cap. (D) Daughter cell (∼360 by 45 μm) with two caps and DNA almost completely separated. (E) Daughter cell (∼360 by 45 μm) with two caps and DNA completely separated. Note mid-cell constriction of DNA in panels B and C that appears unrelated to additional wall formation (contrast with Fig. 4) and condensation of DNA in caps while that along periphery and in center of cell remains decondensed.

Similar articles

Cited by

References

    1. Angert E R, Brooks A E, Pace N R. Phylogenetic analyses of Metabacterium polyspora: clues to the evolutionary origin of daughter cell production in Epulopiscium species, the largest bacteria. J Bacteriol. 1996;178:1451–1456. - PMC - PubMed
    1. Angert E R, Clements K D, Pace N R. The largest bacterium. Nature. 1993;362:239–241. - PubMed
    1. Arndt-Jobin D J, Jobin T M. Fluorescence labeling and microscopy of DNA. Methods Cell Biol. 1989;30:417–448. - PubMed
    1. Bohm N, Sprenger E, Sandritter W. Absorbance and fluorescence cytometry of nuclear Fuelgen DNA. In: Thaer A A, Sernetz M, editors. Fluorescence techniques in cell biology. Berlin, Germany: Springer-Verlag; 1973.
    1. Bresler V, Fishelson L. Microfluorometrical study of benzo(a)pyrene and marker xenobiotics bioaccumulation in the bivalve Donax trunculus from clean and polluted sites along the Mediterranean shore of Israel. Dis Aquat Org. 1994;19:193–202.

Publication types

LinkOut - more resources