

Implications of rRNA operon copy number and ribosome content in the marine oligotrophic ultramicrobacterium Sphingomonas sp. strain RB2256
- PMID: 9797303
- PMCID: PMC106665
- DOI: 10.1128/AEM.64.11.4433-4438.1998
Implications of rRNA operon copy number and ribosome content in the marine oligotrophic ultramicrobacterium Sphingomonas sp. strain RB2256
Abstract
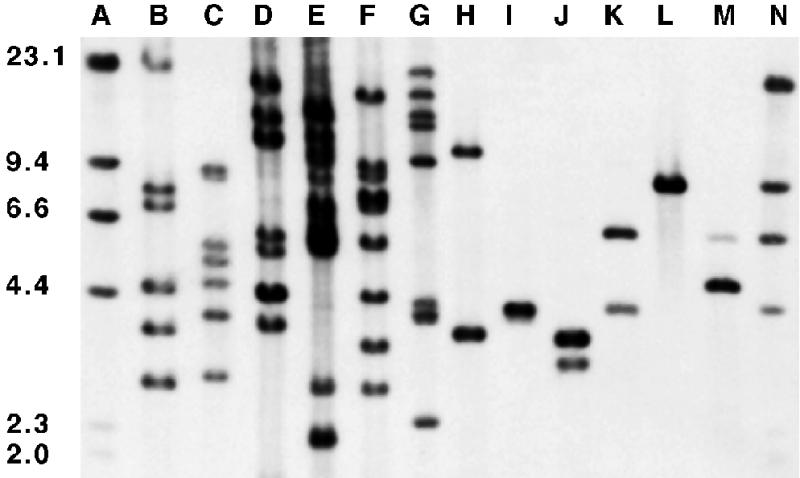
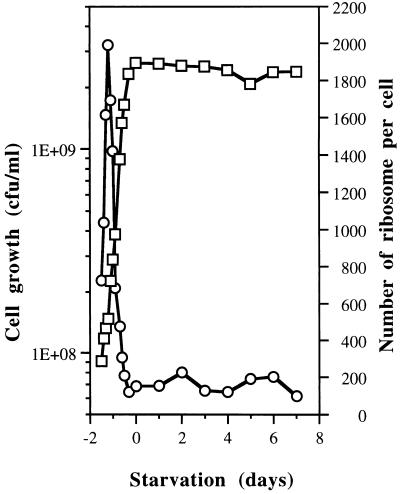
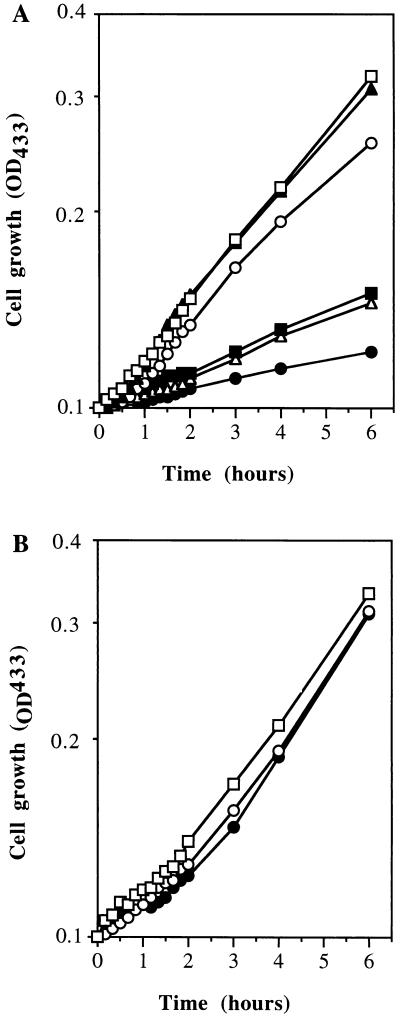
Sphingomonas sp. strain RB2256 is a representative of the dominant class of ultramicrobacteria that are present in marine oligotrophic waters. In this study we examined the rRNA copy number and ribosome content of RB2256 to identify factors that may be associated with the relatively low rate of growth exhibited by the organism. It was found that RB2256 contains a single copy of the rRNA operon, in contrast to Vibrio spp., which contain more than eight copies. The maximum number of ribosomes per cell was observed during mid-log phase; however, this maximum content was low compared to those of faster-growing, heterotrophic bacteria (approximately 8% of the maximum ribosome content of Escherichia coli with a growth rate of 1. 5 h-1). The low number of ribosomes per cell appears to correlate with the low rate of growth (0.16 to 0.18 h-1) and the presence of a single copy of the rRNA operon. However, on the basis of cell volume, RB2256 appears to have a higher concentration of ribosomes than E. coli (approximately double that of E. coli with a growth rate of 1.5 h-1). Ribosome numbers reached maximum levels during mid-log-phase growth but decreased rapidly to 10% of maximum during late log phase through 7 days of starvation. The cells in late log phase and at the onset of starvation displayed an immediate response to a sudden addition of excess glucose (3 mM). This result demonstrates that a ribosome content 10% of maximum is sufficient to allow cells to immediately respond to nutrient upshift and achieve maximum rates of growth. These data indicate that the bulk of the ribosome pool is not required for protein synthesis and that ribosomes are not the limiting factor contributing to a low rate of growth. Our findings show that the regulation of ribosome content, the number of ribosomes per cell, and growth rate responses in RB2256 are fundamentally different from those characteristics in fast-growing heterotrophs like E. coli and that they may be characteristics typical of oligotrophic ultramicrobacteria.
Figures
References
-
- Andersson S G E, Kurland C G. Genomic evolution drives the evolution of the translation system. Biochem Cell Biol. 1995;73:775–787. - PubMed
-
- Bremer H, Dennis P P. Modulation of chemical composition and other parameters of the cell by growth rate. In: Neidhardt F C, Curtiss III R, Ingraham J L, Lin E C C, Low K B, Magasanik B, Reznikoff W S, Riley M, Schaechter M, Umbarger H E, editors. Escherichia coli and Salmonella: cellular and molecular biology. 2nd ed. Vol. 2. Washington, D.C: ASM Press; 1996. pp. 1553–1569.
Publication types
MeSH terms
Substances
LinkOut - more resources
Full Text Sources
Miscellaneous
