. 1998 Nov;64(11):4581-7.
doi: 10.1128/AEM.64.11.4581-4587.1998.

Quantification of 16S rRNAs in complex bacterial communities by multiple competitive reverse transcription-PCR in temperature gradient gel electrophoresis fingerprints

Affiliations

Quantification of 16S rRNAs in complex bacterial communities by multiple competitive reverse transcription-PCR in temperature gradient gel electrophoresis fingerprints

A Felske et al. Appl Environ Microbiol. 1998 Nov.

Abstract

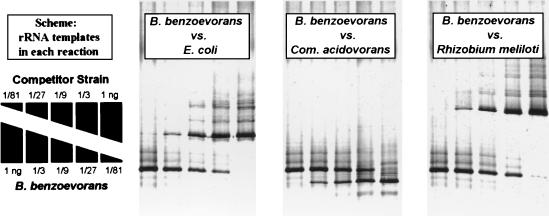
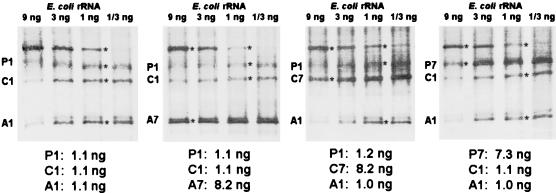
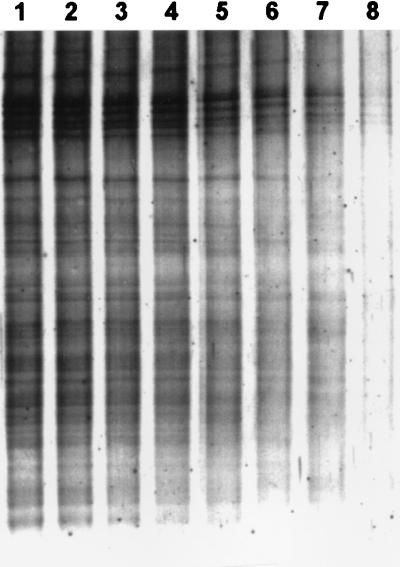
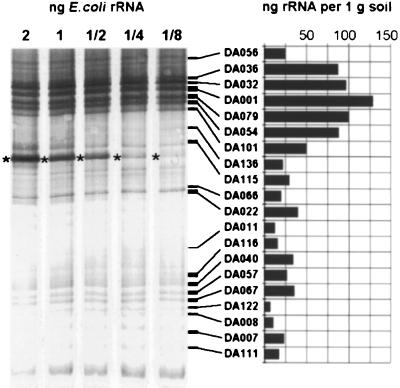
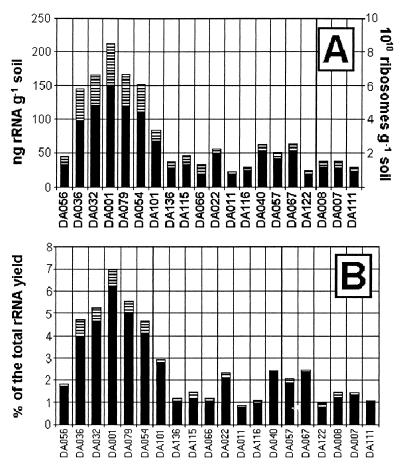
A novel approach was developed to quantify rRNA sequences in complex bacterial communities. The main bacterial 16S rRNAs in Drentse A grassland soils (The Netherlands) were amplified by reverse transcription (RT)-PCR with bacterium-specific primers and were separated by temperature gradient gel electrophoresis (TGGE). The primer pair used (primers U968-GC and L1401) was found to amplify with the same efficiency 16S rRNAs from bacterial cultures containing different taxa and cloned 16S ribosomal DNA amplicons from uncultured soil bacteria. The sequence-specific efficiency of amplification was determined by monitoring the amplification kinetics by kinetic PCR. The primer-specific amplification efficiency was assessed by competitive PCR and RT-PCR, and identical input amounts of different 16S rRNAs resulted in identical amplicon yields. The sequence-specific detection system used for competitive amplifications was TGGE, which also has been found to be suitable for simultaneous quantification of more than one sequence. We demonstrate that this approach can be applied to TGGE fingerprints of soil bacteria to estimate the ratios of the bacterial 16S rRNAs.


Figures

FIG. 1
FIG. 1
Competitive RT-PCR performed with rRNA standards from different bacterial taxa. The scheme on the left shows the order of rRNA input. In the third of the five reactions equal amounts of the two competitor rRNAs are present. This ratio is also reflected by band intensities after separation of the amplicons by TGGE and detection by silver staining (2 μl of RT-PCR product per lane). The faint bands accompanying the main bands were RT-PCR side products and were not included in the quantitative analysis. We used more RT-PCR product than necessary to visualize traces of the out-competed sequence. However, the highly sensitive silver staining method also detected some RT-PCR side products, most likely side products representing a DNA polymerization bias.
FIG. 2
FIG. 2
Amplification kinetics of 30 different 16S rDNA sequences: detection signal value versus PCR cycle number. The templates used were different 16S rDNA amplicon samples, and three different amounts (1 ng, 200 pg, and 40 pg) were tested. (A) The target was a 16S rDNA amplicon from E. coli. (B) The target was a 16S rDNA amplicon of clone DA001. (C) Normalized results of all experiments and parallel experiments performed with 10 pure-culture organisms (30 kinetics experiments). (D) Normalized results of all experiments and parallel experiments performed with 20 environmental sequences (60 kinetics experiments). The slopes were used to calculate the amplification factor per cycle (1.341 in panel C and 1.346 in panel D). The error bars indicate the minimal and maximal deviations in the data sets.
FIG. 3
FIG. 3
Four multiple-competitor RT-PCR of rRNA with four competing rRNAs resolved by TGGE and detected by silver staining (2 μl of RT-PCR product per lane). E. coli rRNA was applied at different dilutions, as indicated. Signals A1 and A7 represented 1 and 7 ng of rRNA from Arthrobacter atrocyaneus. Signals C1 and C7 represented Comamonas acidovorans, and signals P1 and P7 represented Pseudomonas fluorescens. Each rRNA was quantified in the lane in which the intensity of the corresponding E. coli signal (indicated by an asterisk) was most similar in relation to the amount of rRNA represented by the E. coli signal. Results are given below the fingerprints.
FIG. 4
FIG. 4
Silver-stained TGGE gel with PCR products from soil DNA from sample A1 (12 μl of RT-PCR product per lane). Lane 1 contained the PCR product generated from 100 pg of template DNA. Lanes 2 through 8 contained twofold serial dilutions of template DNA. Lane 8 contained approximately 0.8 pg of template DNA, which might represent a few hundred genomic units of soil bacteria.
FIG. 5
FIG. 5
Multiple-competitor RT-PCR of rRNA from soil sample A1 resolved by TGGE and detected by silver staining (12 μl of RT-PCR product per lane). The 20 signals selected for quantification are indicated; the designations have been described previously (12). The 20 sequences were quantified with image analysis software. Each sequence was quantified in the lane in which the intensity of the corresponding E. coli signal (indicated with an asterisk) was most similar in relation to the amount of rRNA represented by the E. coli signal and the amount of soil (10 mg) represented by the soil rRNA template.
FIG. 6
FIG. 6
Average rRNA yields for the 20 sequences in Fig. 5, based on 40 soil samples. The striped columns indicate the standard deviations. (A) Total amounts of rRNA. (B) Relative amounts as part of the total rRNA yield as estimated by quantitative dot blot hybridization with Bacteria-specific probe EUB338.

References

    1. Alard P, Lantz O, Sebagh M, Calvo C F, Weill D, Chavanel G, Senik A, Charpentier B. A versatile ELISA-PCR assay for mRNA quantitation from a few cells. BioTechniques. 1993;15:730–737. - PubMed
    1. Amann R I, Krumholz L, Stahl D A. Fluorescent-oligonucleotide probing of whole cells for determinative, phylogenetic, and environmental studies in microbiology. J Bacteriol. 1990;172:762–770. - PMC - PubMed
    1. Becker-André M, Hahlbrock K. Absolute mRNA quantification using the polymerase chain reaction (PCR). A novel approach by a PCR aided transcript titration assay (PATTY) Nucleic Acids Res. 1989;17:9437–9446. - PMC - PubMed
    1. Blok H J, Gohlke A, Akkermans A D L. Quantitative analysis of 16S rDNA using competitive PCR and the QPCR System 5000. BioTechniques. 1997;22:700–704. - PubMed
    1. Buck K J, Harris R A, Sikela J M. A general method for quantitative PCR analysis of mRNA levels for members of gene families: application to GABAA receptor subunits. BioTechniques. 1991;11:636–641. - PubMed

Publication types

LinkOut - more resources