. 1998 Jun;82(6):684-90.
doi: 10.1136/bjo.82.6.684.

Retinal nerve fibre layer polarimetry: histological and clinical comparison

Affiliations

Retinal nerve fibre layer polarimetry: histological and clinical comparison

J E Morgan et al. Br J Ophthalmol. 1998 Jun.

Abstract

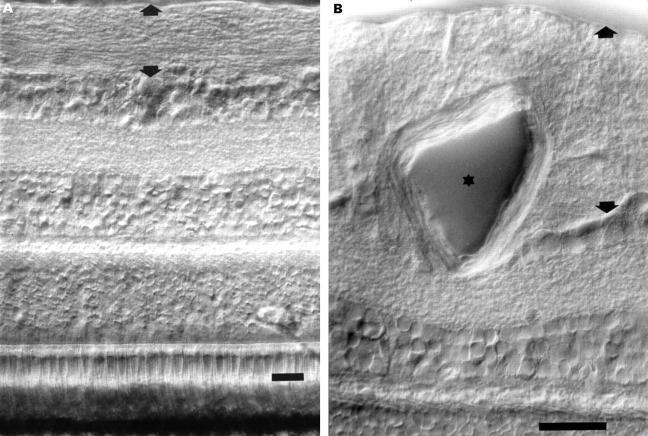
Aims: To compare histological thickness of the retinal nerve fibre layer in the primate with retardation measurements obtained in vivo using the Mark II Nerve Fiber Analyzer (NFA, Laser Diagnostic Technologies, San Diego, USA).

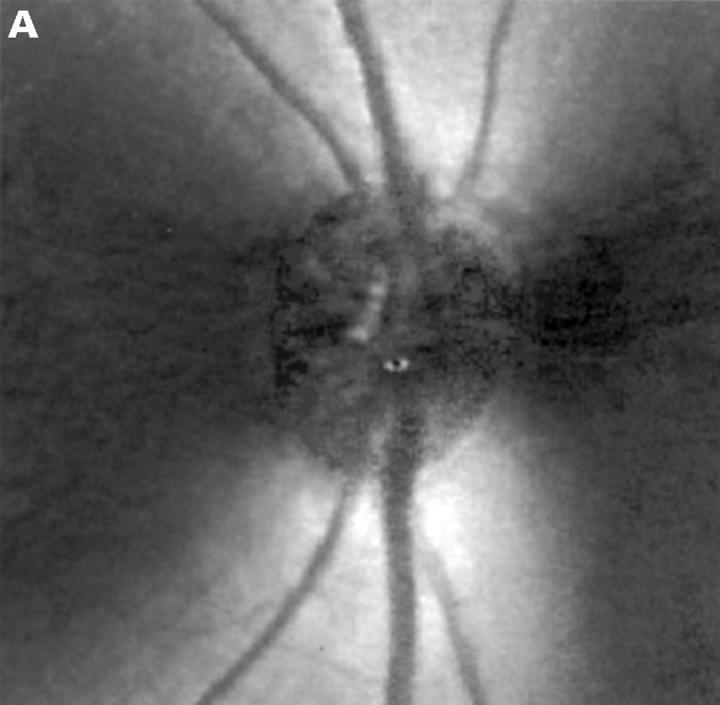
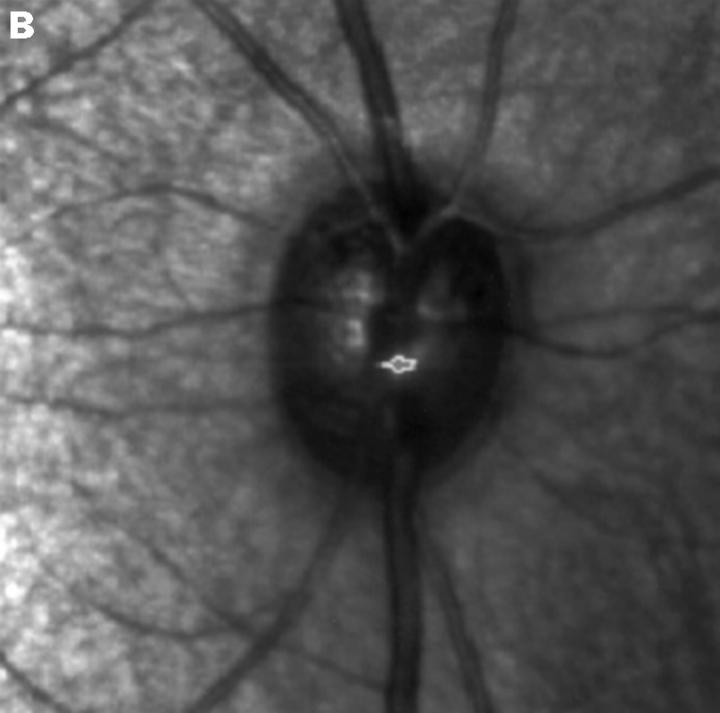
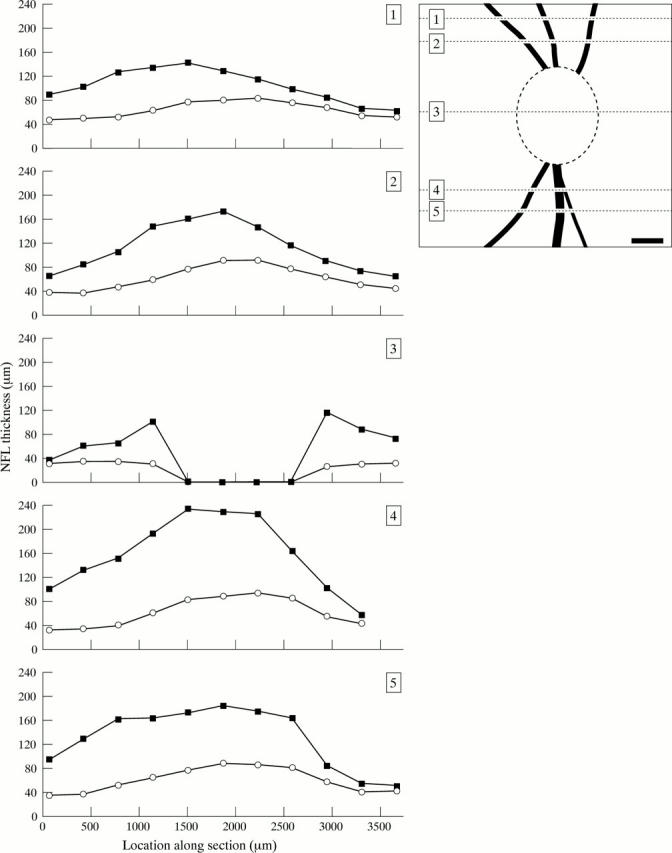
Methods: Scanning laser polarimetry was performed on both eyes of a healthy anaesthetised adult primate (Macaca mulatta). The retinal nerve fibre layer thickness was measured in the eye with the best polarimetry image. A nerve fibre layer thickness map was scaled and aligned to a retardation map to permit correlation of retardation and thickness measurements.

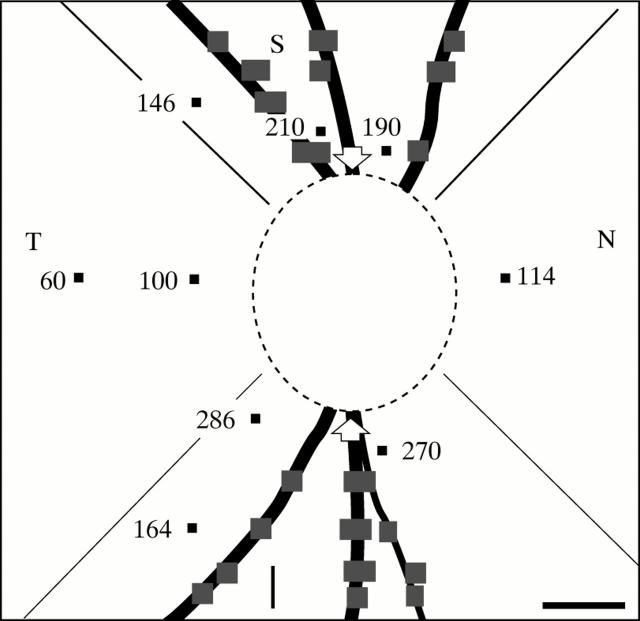
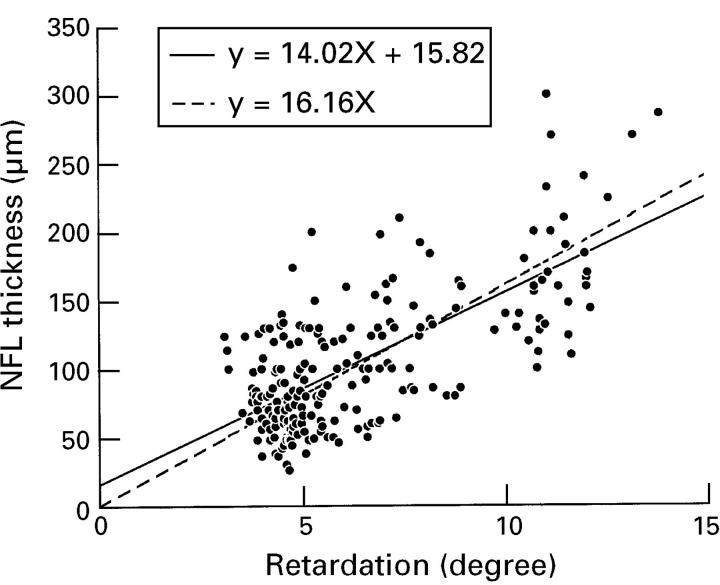
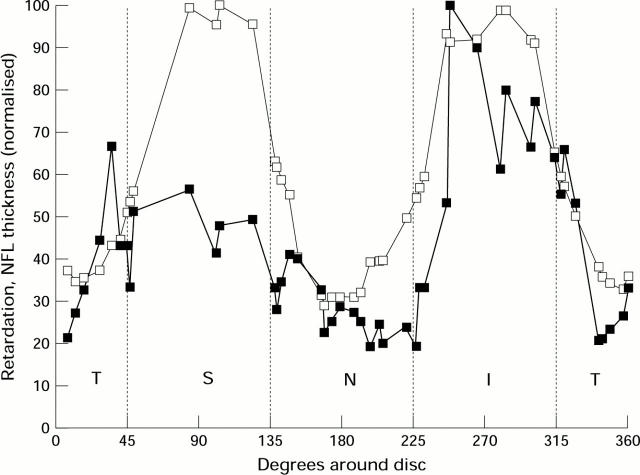
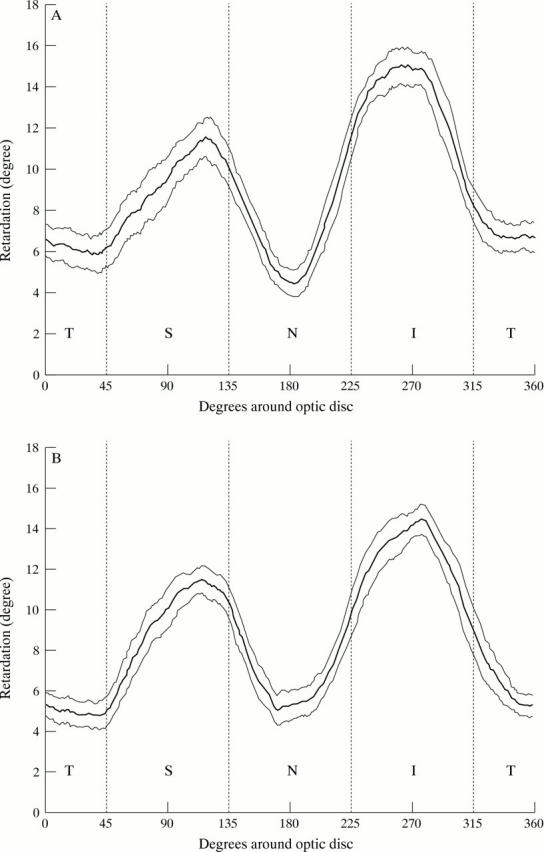
Results: Retinal nerve fibre layer thickness measurements could be satisfactorily aligned with corresponding retardation values at 216 locations. The overall correlation coefficient for nerve fibre layer thickness and retardation was r = 0.70 (n = 216, p < 0.001). Regional comparison showed the best correlation (r = 0.76, n = 45, p < 0.001) occurred inferior to the optic disc. Less positive but still highly significant correlations were seen superiorly and temporally (r = 0.52, n = 26, p = 0.007 and r = 0.49, n = 86, p = < 0.001 respectively), with the lowest correlation occurring at the nasal aspect of the disc (r = 0.06, n = 67, p = 0.64).

Conclusions: In the primate eye, retinal nerve fibre layer thickness shows a positive correlation with retardation measurements obtained with the nerve fibre analyser. However, since the correlation coefficient varied around the optic disc, further evaluation of the device is advised before its routine clinical use.


Figures

Figure 1
Figure 1
(A) Image of the optic disc of the right eye showing peripapillary birefringence. In the grey scale view, lighter pixels correspond to areas of higher retardation. (B) Extended focus image of the optic disc obtained at the time of the polarimetric scan. The bright spot just inferior to the centre of the optic disc is an imaging artefact.
Figure 1
Figure 1
(A) Image of the optic disc of the right eye showing peripapillary birefringence. In the grey scale view, lighter pixels correspond to areas of higher retardation. (B) Extended focus image of the optic disc obtained at the time of the polarimetric scan. The bright spot just inferior to the centre of the optic disc is an imaging artefact.
Figure 2
Figure 2
Photomicrographs showing the retinal nerve fibre layer as seen with Normarski optics. (A) At the edge of the macula, the retinal layers can clearly be seen. Scale bar 50 µm. (B) At the disc margin large vessels are seen within the nerve fibre layer. The nerve fibre layer retinal ganglion cell interface is shown (arrow). Scale bar 50 µm.
Figure 3
Figure 3
Diagram showing representative retinal nerve fibre layer thickness measurements (µm) with respect to the disc margin (interrupted line). Major blood vessels are shaded in black and correspond to the field of view in Figure 1. Peripapillary retina is divided into superior (S), inferior (I), temporal (T), nasal (N) sectors by lines that intersect at 90 degrees at the centre of the optic disc. Scale bar 2 degrees (495 µm).
Figure 4
Figure 4
Plots showing the change in retardation and histological retinal nerve fibre layer thickness along representative sections. The inset figure of the optic disc shows the location and orientation of the sections. Retardation is expressed as µm of nerve fibre layer (NFL) thickness (digital retardation value × 7.4).
Figure 5
Figure 5
Plot of retardation value against measured nerve fibre layer (NFL) thickness for all thickness retardation pairs. n = 216. r = 0.70, p = <0.001. The equation describing the straight line fits is shown inset. The broken line shows the straight line fit through the origin.
Figure 6
Figure 6
Plot of retardation and corresponding nerve fibre layer (NFL) thickness measures for points lying within a 1.5-2.0 disc diameter zone (from the disc centre) around the optic disc. The temporal aspect of the disc lies at 0 degrees and the superior aspect at 90 degrees. Bold line, solid markers: nerve fibre layer thickness. Fine line, open markers; retardation. Retardation and thickness scales have been normalised relative to their peak values to facilitate comparison.
Figure 7
Figure 7
Plot of retinal nerve fibre layer (RNFL) around the optic disc for 10 normal (non-glaucomatous) patients. Bold line, mean RNFL. Fine lines show the 95% confidence intervals. (A) right eyes, (B) left eyes.

References

    1. J Opt Soc Am A. 1987 Jan;4(1):82-90 - PubMed
    1. Vision Res. 1985;25(12):1795-810 - PubMed
    1. Int Ophthalmol. 1989 Jan;13(1-2):25-9 - PubMed
    1. Ophthalmology. 1989 May;96(5):627-32 - PubMed
    1. Ophthalmology. 1989 May;96(5):633-39; discussion 639-41 - PubMed