. 1998 Nov 15;18(22):9517-28.
doi: 10.1523/JNEUROSCI.18-22-09517.1998.

Synaptic integration in striate cortical simple cells

Affiliations

Synaptic integration in striate cortical simple cells

J A Hirsch et al. J Neurosci. .

Abstract

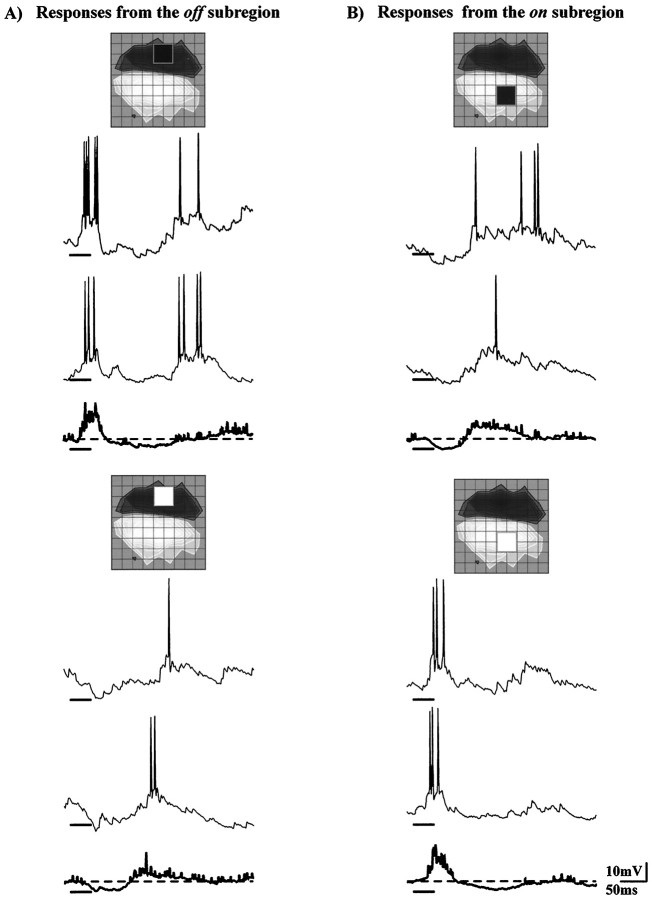
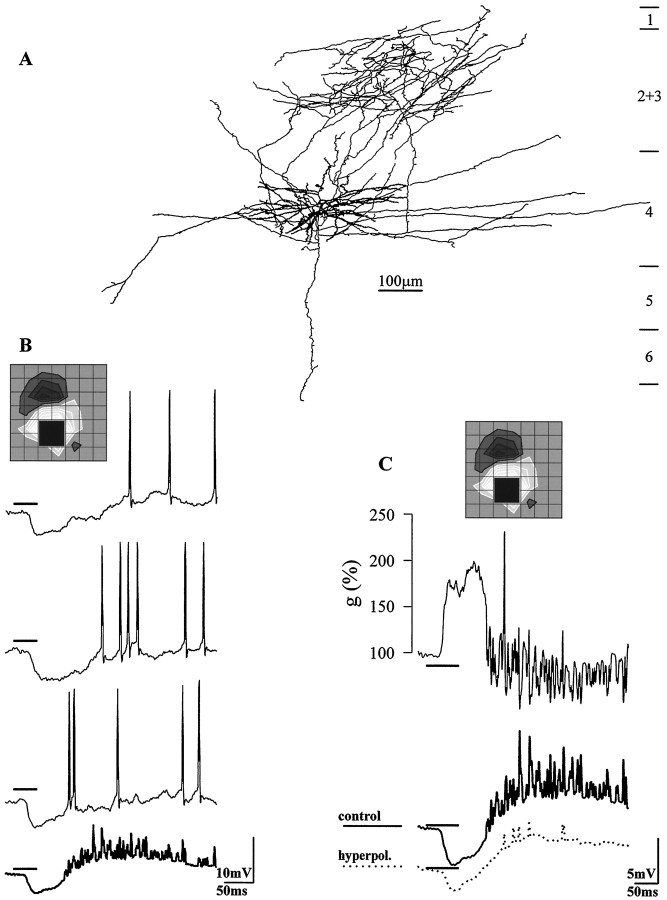
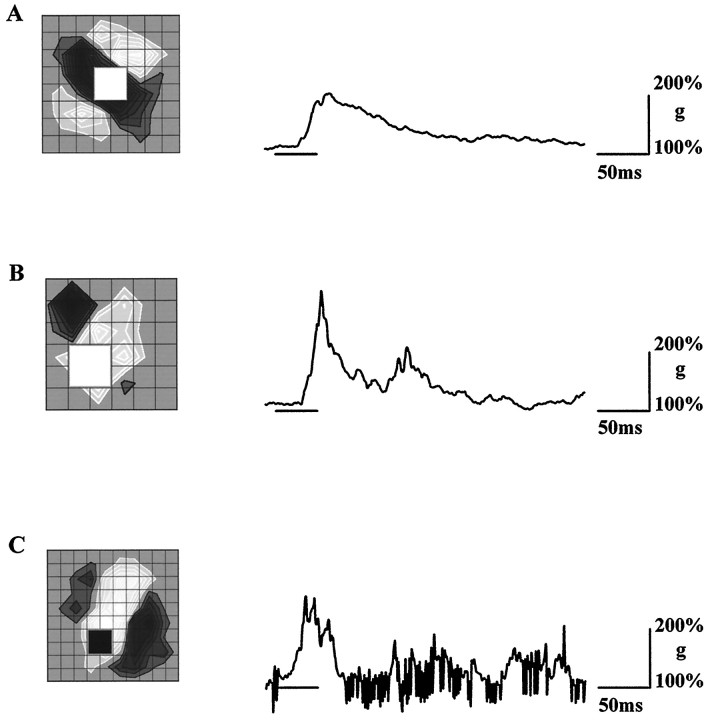
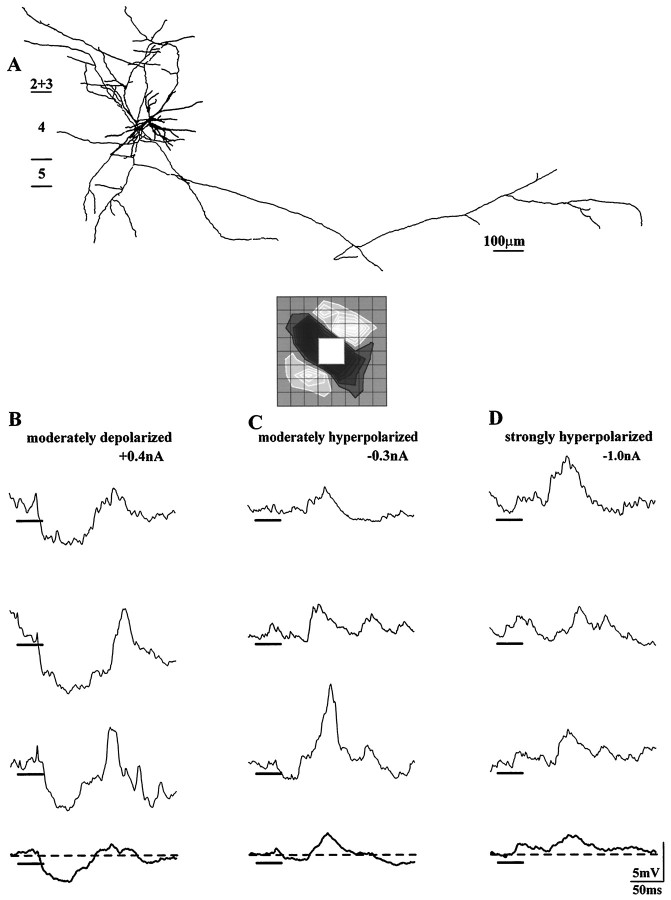
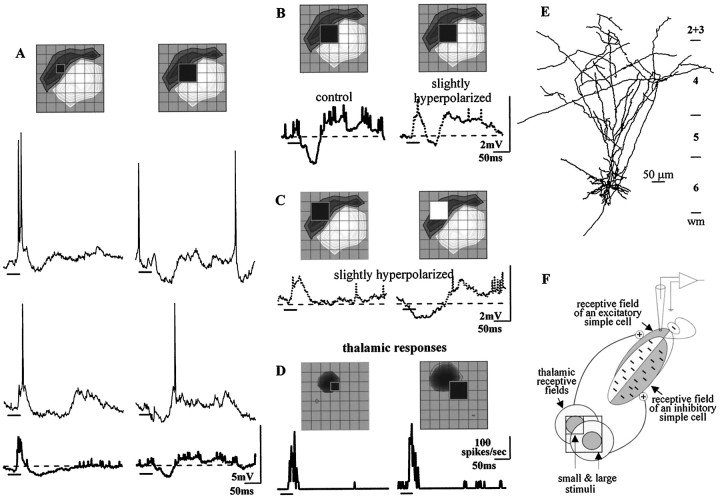
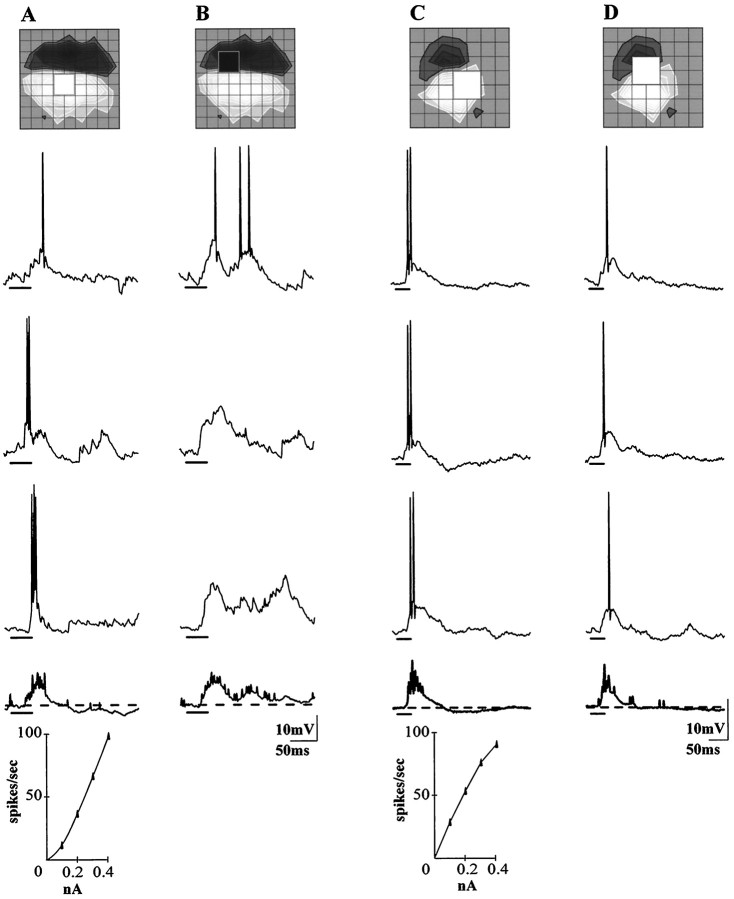
Simple cells in the visual cortex respond to the precise position of oriented contours (Hubel and Wiesel, 1962). This sensitivity reflects the structure of the simple receptive field, which exhibits two sorts of antagonism between on and off inputs. First, simple receptive fields are divided into adjacent on and off subregions; second, within each subregion, stimuli of the reverse contrast evoke responses of the opposite sign: push-pull (Hubel and Wiesel, 1962; Palmer and Davis, 1981; Jones and Palmer, 1987; Ferster, 1988). We have made whole-cell patch recordings from cat area 17 during visual stimulation to examine the generation and integration of excitation (push) and suppression (pull) in the simple receptive field. The temporal structure of the push reflected the pattern of thalamic inputs, as judged by comparing the intracellular cortical responses to extracellular recordings made in the lateral geniculate nucleus. Two mechanisms have been advanced to account for the pull-withdrawal of thalamic drive and active, intracortical inhibition (Hubel and Wiesel, 1962; Heggelund, 1968; Ferster, 1988). Our results suggest that intracortical inhibition is the dominant, and perhaps sole, mechanism of suppression. The inhibitory influences operated within a wide dynamic range. When inhibition was strong, the membrane conductance could be doubled or tripled. Furthermore, if a stimulus confined to one subregion was enlarged so that it extended into the next, the sign of response often changed from depolarizing to hyperpolarizing. In other instances, the inhibition modulated neuronal output subtly, by elevating spike threshold or altering firing rate at a given membrane voltage.


Figures

Fig. 1.
Fig. 1.
Push and pull in the simple cell response. Postsynaptic responses evoked by dark or bright stimuli that fell inside the off or the on subregion of a simple cell in upper layer 6. Each panel shows two individual responses to the stimulus with the average of all 16 as the boldtrace beneath. The position and sign of the stimulus is indicated in the receptive field map (the peak of the on subregion is light and that of the off subregions is dark; grid spacing is 0.4°) above each panel. Stimulus duration is marked by the bold bar under each trace in this and subsequent figures. A, A dark square flashed in theoff subregion elicited an initial depolarization and late hyperpolarization, top, whereas a bright square at the same site evoked a hyperpolarization and subsequent depolarization,bottom. B, Responses from theon subregion mirror those from theoff.
Fig. 2.
Fig. 2.
Visually evoked suppression is accompanied by an increase in the membrane conductance. A, Reconstruction of the cell, a spiny stellate cell in layer 4. B, A dark square flashed within the on subregion evoked a brisk hyperpolarization, as shown in three individual trials of the stimulus and the average of sixteen trials (bold).C, Top trace, Plot of conductance during the visual response: g(t)=K(IpIn)/(Vp(t) − Vn(t));g(t) is the normalized conductance at time t, IpIn is the difference between the values of constant current injected through the electrode, andVp(t) andVn(t) are the membrane voltages recorded while the membrane was held at the relatively positive and negative levels. The averaged responses obtained at the control and hyperpolarized levels that were used to calculateg(t) are shownbelow the graph. Grid spacing was 0.85°.
Fig. 3.
Fig. 3.
The time course of conductance increase during visually evoked suppression in three simple cells.A, B, Records from two layer 4 spiny stellate cells recorded with QX-314 in the electrode (the receptive field of cell B fell slightly outside of the stimulus grid). C, Record from a pyramid at the upper border of layer 4. Grid spacing: A, B, 0. 85°;C, 0. 4°.
Fig. 4.
Fig. 4.
Reversal of the visually evoked suppression. Reconstruction of the cell, a spiny stellate cell in layer 4 (A). Responses to a stimulus of the inappropriate polarity recorded while the membrane was held at three different levels of polarization. When the membrane was moderately depolarized, the initial response was hyperpolarizing (B). When membrane potential was stepped to more hyperpolarized levels, the response amplitude diminished (C), and then reversed (D). Recordings were actually collected in the order C, B, D; action potentials were suppressed with 10 mm QX-314. Grid spacing was 0.85°.
Fig. 5.
Fig. 5.
Antagonism between subregions in the simple receptive field. A, Left, A small dark square confined to the off subregion evoked a depolarization. Right, A larger stimulus that spread into the on subregion suppressed the excitation driven through the off subregion. B, The averaged response to the large square (as in A) shown beside the averaged response to an identical stimulus flashed while the membrane was slightly hyperpolarized. The inhibition that dominated theright trace suppressed the excitation visible in theleft trace. C, Responses to large dark (left) and bright (right) squares that avoided the on subregion recorded while the membrane was at the hyperpolarized level. Left, The excitatory component of the response to the overlapping stimulus (i.e.,B, right) matched the excitation evoked by the dark stimulus that fell inside the off subregion.Right, The response to the bright stimulus shows that the membrane voltage had remained above the reversal potential for inhibition. D, Receptive fields and poststimulus time histograms from an extracellularly recorded, off center LGN X cell monitored at the same time as the cortical simple cell. The large spot (right) drove more spikes than the small one did (left), although the large spot fell mainly outside the center. (The subsample of the stimulus grid for the simple cell is shifted down two pixels from that for the relay cell.)E, The cell was a pyramid in layer 6. F, Possible circuit: the receptive field of superimposed inhibitory simple cell whose subregions are reversed compared with those of patched neuron, the fields of antecedent thalamic cells and relative stimulus placement. Grid spacing, 0.4°.
Fig. 6.
Fig. 6.
Alternate forms of subfield antagonism.A, B, Responses to stimuli confined to the home subregion evoked a depolarization that was smaller (A) but more effective in triggering spikes than the larger depolarization evoked by a stimulus that just crossed the border between subregions (B); same cell as in Figure 1. C, D, A second example of the slight dissociation between firing rate and threshold seen when comparing responses evoked within the home subregion (C) to those evoked by a stimulus that crossed the border between subregions; same cell as in Figure 3. Theinsets beneath the traces show that spike frequency increased monotonically with injection of direct depolarizing current pulses for each cell.

References

    1. Ahmed B, Anderson JC, Douglas RJ, Martin KM, Nelson JC. Polyneuronal innervation of spiny stellate neurons in cat visual cortex. J Comp Neurol. 1994;341:39–49. - PubMed
    1. Allen C, Stevens CF. An evaluation of causes of unreliability of synaptic transmission. Proc Natl Acad Sci USA. 1994;9:10380–10383. - PMC - PubMed
    1. Alonso JM, Usrey WM, Reid RC. Precisely correlated firing in cells of the lateral geniculate nucleus. Nature. 1996;383:815–819. - PubMed
    1. Bal T, von Krosigk M, McCormick DA. Synaptic and membrane mechanisms underlying synchronized oscillations in the ferret lateral geniculate nucleus in vitro. J Physiol (Lond) 1995;483:641–663. - PMC - PubMed
    1. Berman NJ, Douglas RJ, Martin KAC, Whitteridge D. Mechanisms of inhibition in cat visual cortex. J Physiol (Lond) 1991;440:697–722. - PMC - PubMed

Publication types

LinkOut - more resources