. 1998 Nov 1;12(21):3442-51.
doi: 10.1101/gad.12.21.3442.

Not just scaffolding: plectin regulates actin dynamics in cultured cells

Affiliations

Not just scaffolding: plectin regulates actin dynamics in cultured cells

K Andrä et al. Genes Dev. .

Abstract

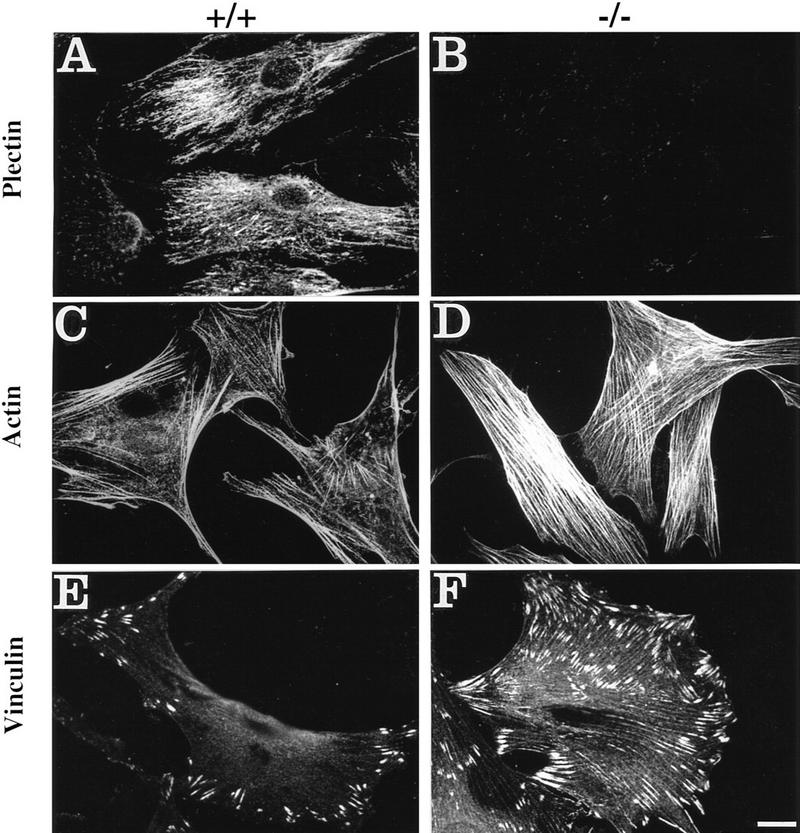
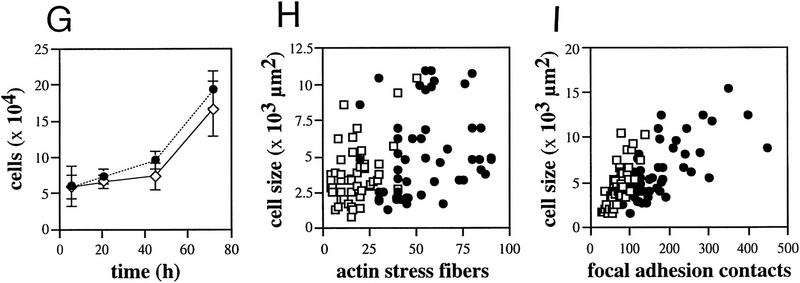
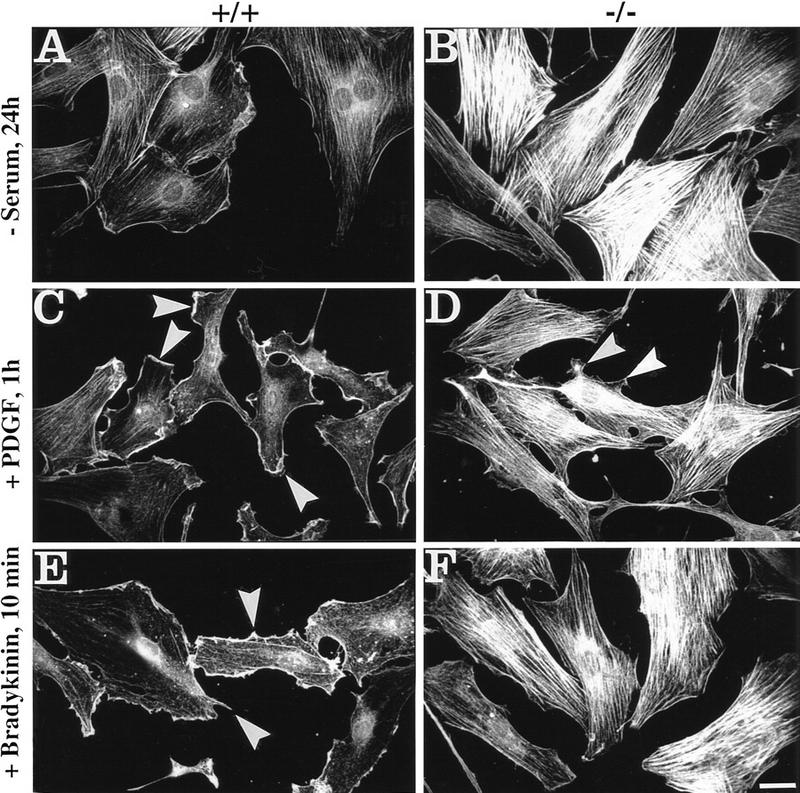
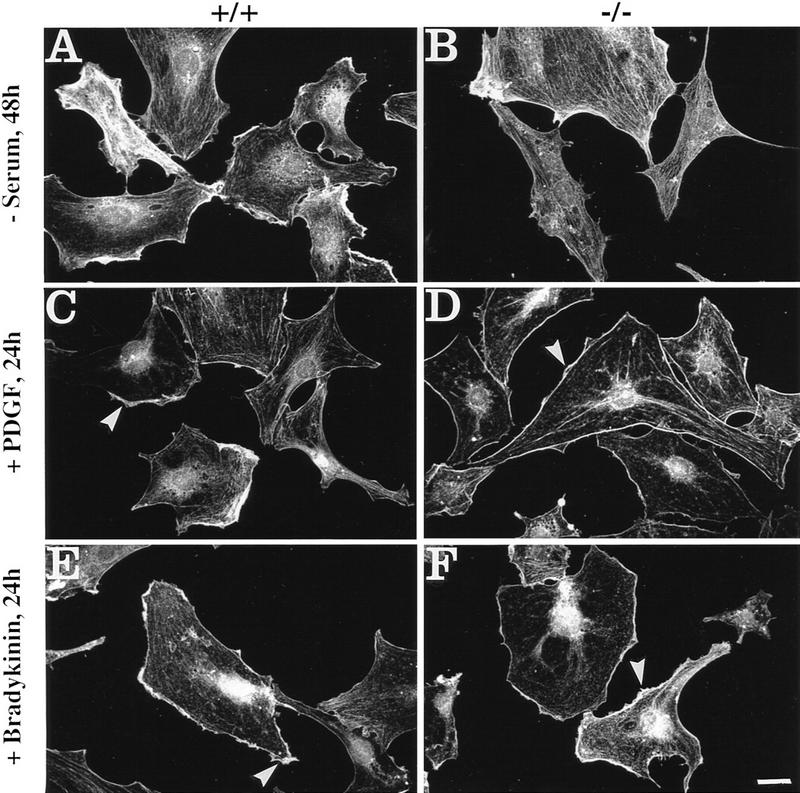
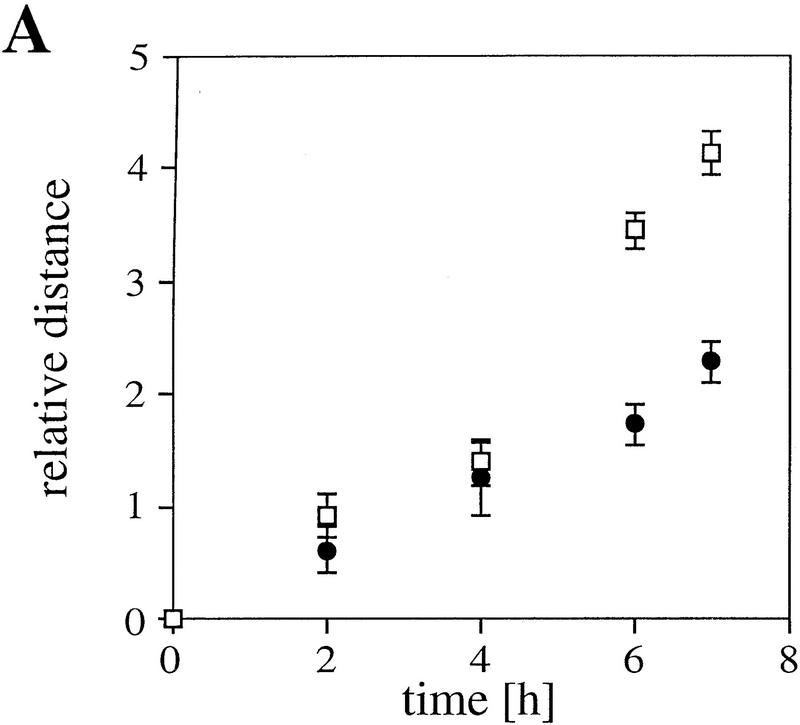
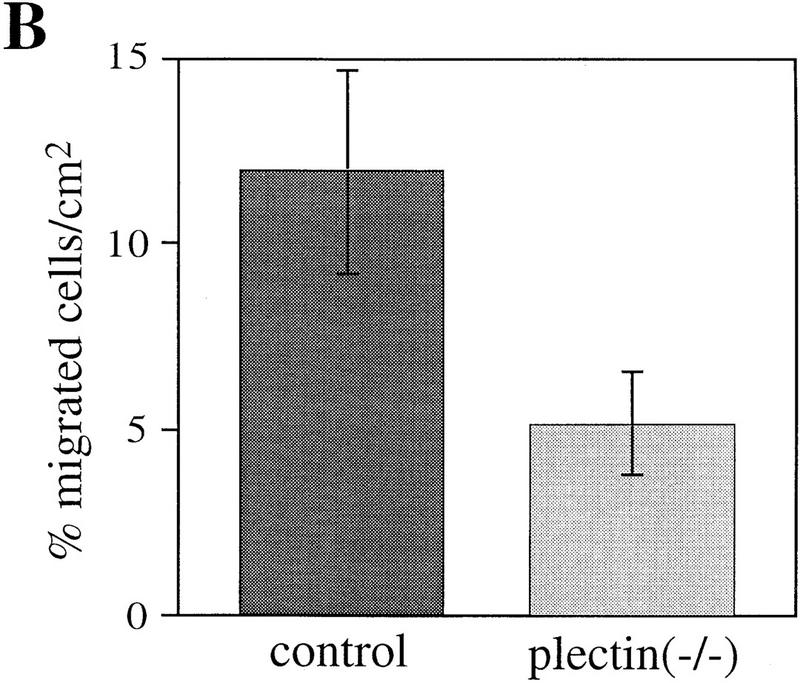
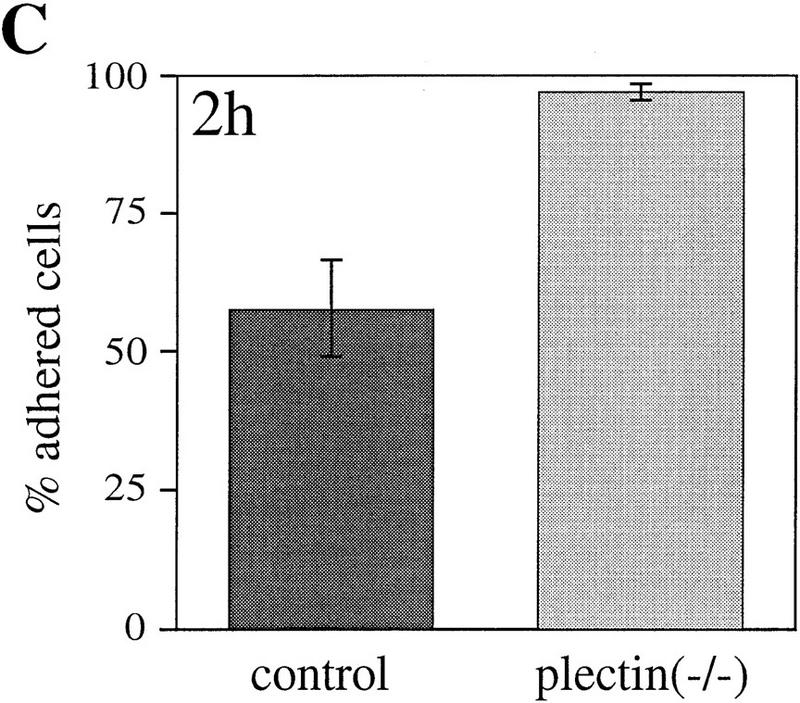
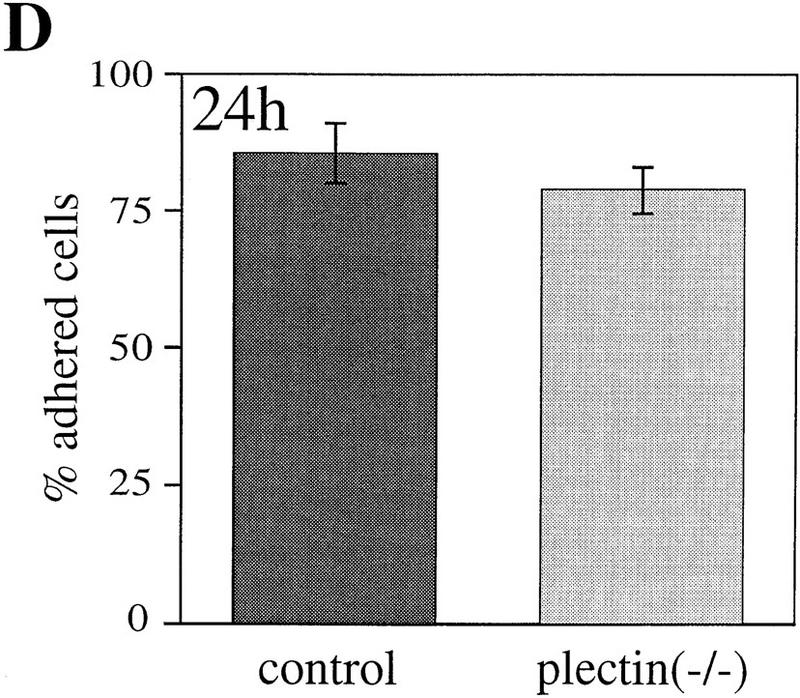
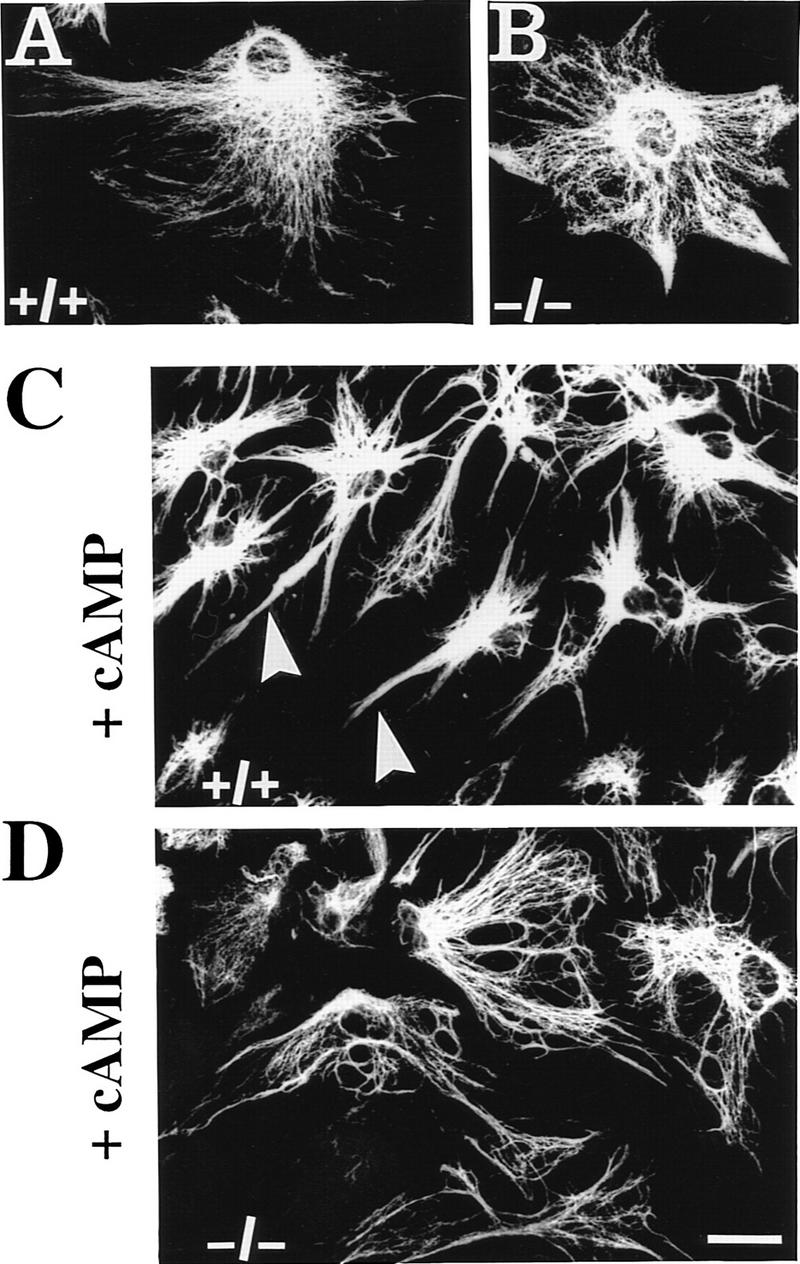
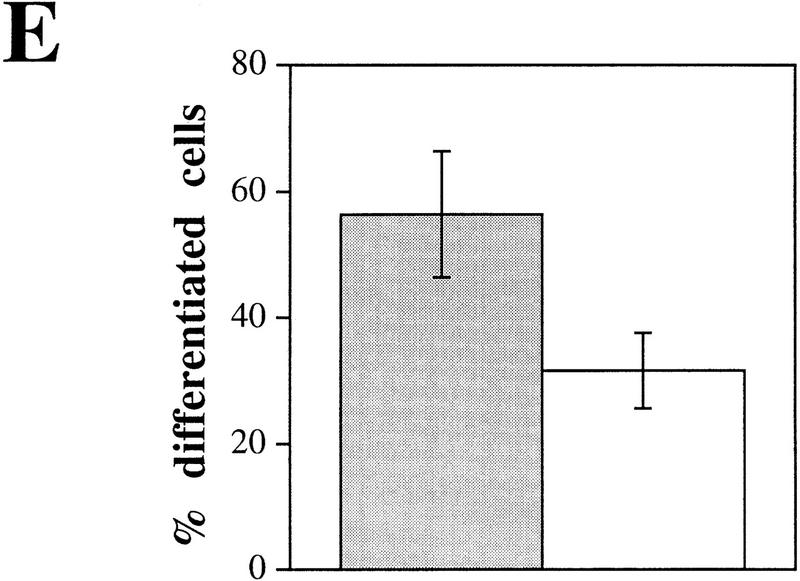
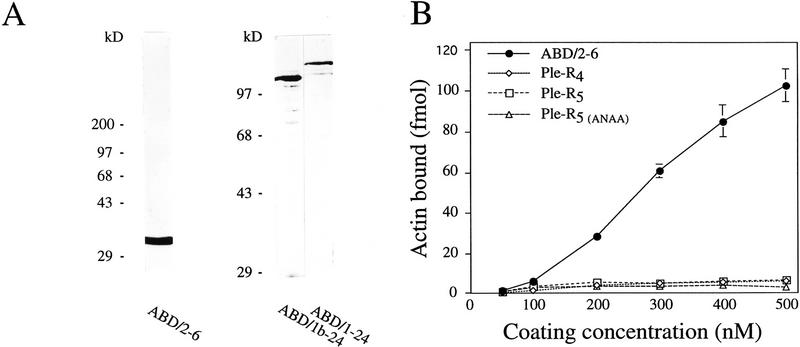
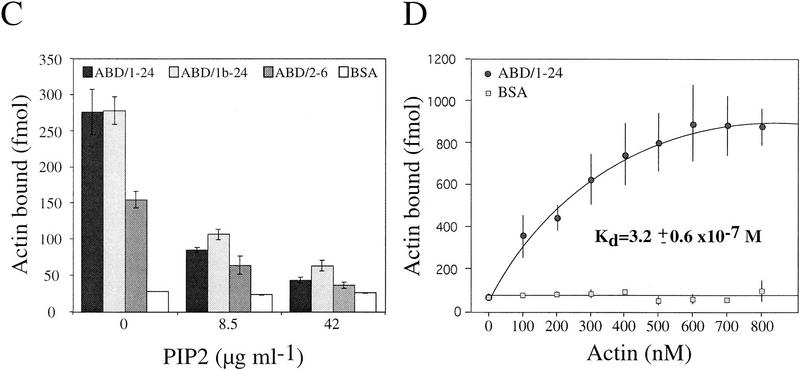
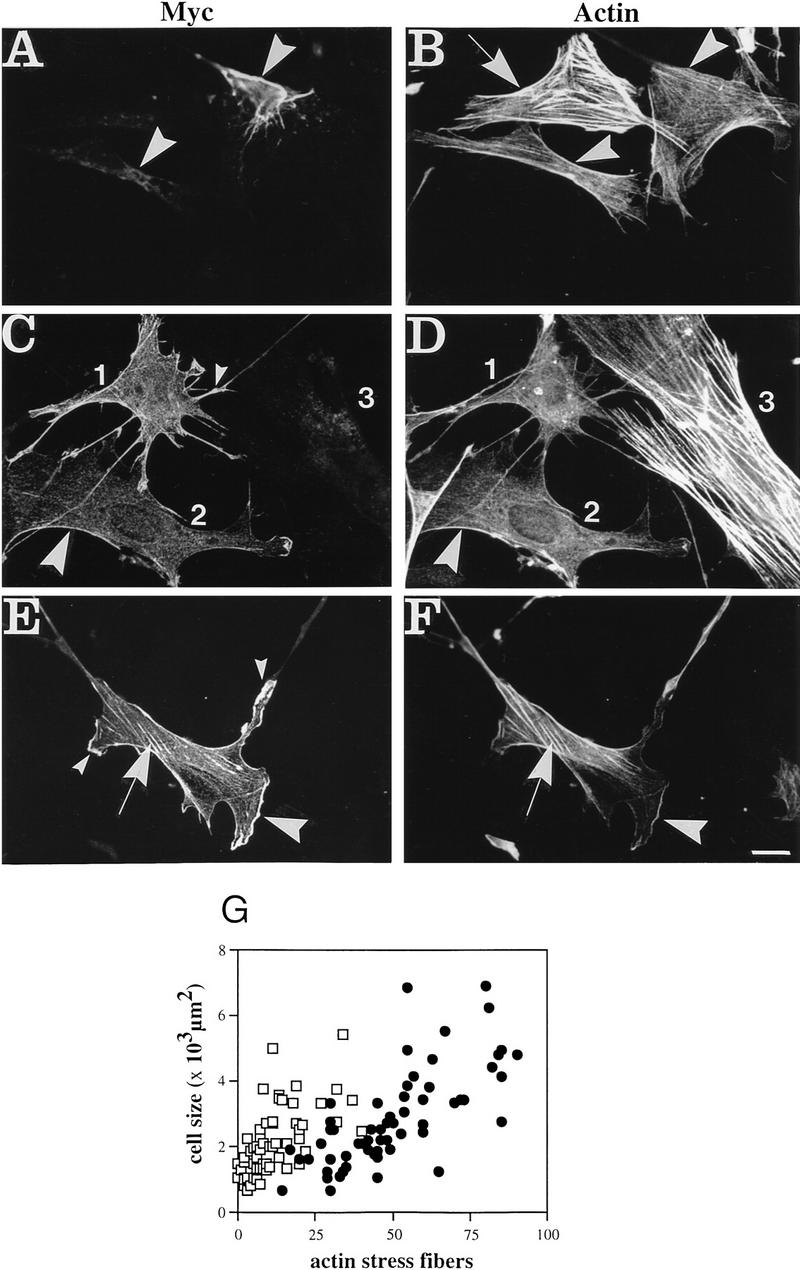
Plectin, a major linker and scaffolding protein of the cytoskeleton, has been shown to be essential for the mechanical integrity of skin, skeletal muscle, and heart. Studying fibroblast and astroglial cell cultures derived from plectin (-/-) mice, we found that their actin cytoskeleton, including focal adhesion contacts, was developed more extensively than in wild-type cells. Also it failed to show characteristic short-term rearrangments in response to extracellular stimuli activating the Rho/Rac/Cdc42 signaling cascades. As a consequence, cell motility, adherence, and shear stress resistance were altered, and morphogenic processes were delayed. Furthermore, we show that plectin interacts with G-actin in vitro in a phosphatidylinositol-4,5-biphosphate-dependent manner and associates with actin stress fibers in living cells. The actin stress fiber phenotype of plectin-deficient fibroblasts could be reversed to a large degree by transient transfection of full-length plectin or plectin fragments containing the amino-terminal actin-binding domain (ABD). These results reveal a novel role of plectin as regulator of cellular processes involving actin filament dynamics that goes beyond its proposed role in scaffolding and mechanical stabilization of cells.


Figures

Figure 1
Figure 1
Augmentation of actin stress fibers and focal adhesion contacts in plectin-deficient fibroblasts during early spreading. Plectin+/+ and plectin−/− fibroblasts were processed for immunofluorescence microscopy after an attachment period of 2 hr. Anti-plectin (A,B), anti-actin (C,D), and anti-vinculin (E,F) were used as primary antibodies. Note higher numbers of stress fibers (C,D) and more numerous and enlarged focal adhesion contacts (E,F) in plectin-deficient cells (D,F), compared to control cells; also, in plectin−/− cells FACs are evenly, rather than peripherally, distributed over the cell (F). (G) Growth curves of plectin-deficient (• ± s.d., n = 6) and control fibroblasts (⋄ ± s.d., n = 6). (H,I) Numerical analysis of actin stress fibers (H) and FACs (I) in control (□) and plectin-deficient fibroblasts (•). Data points represent individual cells. Note higher number of stress fibers and FACs in plectin-deficient cells vs. control cells of similar sizes. Bar, 30 μm.
Figure 1
Figure 1
Augmentation of actin stress fibers and focal adhesion contacts in plectin-deficient fibroblasts during early spreading. Plectin+/+ and plectin−/− fibroblasts were processed for immunofluorescence microscopy after an attachment period of 2 hr. Anti-plectin (A,B), anti-actin (C,D), and anti-vinculin (E,F) were used as primary antibodies. Note higher numbers of stress fibers (C,D) and more numerous and enlarged focal adhesion contacts (E,F) in plectin-deficient cells (D,F), compared to control cells; also, in plectin−/− cells FACs are evenly, rather than peripherally, distributed over the cell (F). (G) Growth curves of plectin-deficient (• ± s.d., n = 6) and control fibroblasts (⋄ ± s.d., n = 6). (H,I) Numerical analysis of actin stress fibers (H) and FACs (I) in control (□) and plectin-deficient fibroblasts (•). Data points represent individual cells. Note higher number of stress fibers and FACs in plectin-deficient cells vs. control cells of similar sizes. Bar, 30 μm.
Figure 2
Figure 2
Impairment of actin cytoskeleton rearrangement in response to Rho, Rac, and Cdc42 activation in plectin-deficient vs. control cells. Cells exposed to serum starvation (−serum), or treatment with PDGF or bradykinin, as indicated, were analyzed by immunofluorescence microscopy using antibodies to actin. Note contrast between serum-starved plectin+/+ (A) and plectin−/− (B) mouse fibroblasts in number and density of actin stress fibers. In normal cells formation of membrane ruffles and lamellipodia (C, arrowheads) and microspikes (E, arrowheads) were induced upon treatment with PDGF and bradykinin, respectively, but not in plectin−/− cells (D,F), except for very few cell protrusions resembling ruffles (D, arrowheads). Bar, 30 μm.
Figure 3
Figure 3
Impairment of actin cytoskeleton rearrangement in response to Rho, Rac, and Cdc42 activation is abolished in plectin-deficient cells upon 48 hr serum starvation and prolonged treatment (24 hr) with PDGF or bradykinin. Cells were analyzed by immunofluorescence microscopy using antibodies to actin. Note loss of actin stress fibers in serum-starved, PDGF-treated, or bradykinin-treated normal fibroblasts (A,C,E), similar to plectin−/− mouse fibroblasts (B,D,F), and the visualization of similar membrane-associated structures in both cell types after incubation with PDGF (C,D, arrowheads), and short microspikes after treatment with bradykinin (E,F, arrowheads).
Figure 4
Figure 4
Reduced motility and enhanced adhesion of plectin-deficient fibroblasts. (A) Wound-healing assay. Note significantly reduced migration rate of plectin-deficient fibroblasts (•) compared to control cells (□). Each data point represents the mean ± s.d. (n = 10); significant differences are observed after 6–7 hr. (B) Migration through filter membrane in response to a gradient of PDGF (mean ± s.d., n = 6). (C,D) Shear stress resistance measurements (mean ± s.d., n = 6). Assays were carried out 2 hr (B,C) or 24 hr (D) after plating of cells.
Figure 4
Figure 4
Reduced motility and enhanced adhesion of plectin-deficient fibroblasts. (A) Wound-healing assay. Note significantly reduced migration rate of plectin-deficient fibroblasts (•) compared to control cells (□). Each data point represents the mean ± s.d. (n = 10); significant differences are observed after 6–7 hr. (B) Migration through filter membrane in response to a gradient of PDGF (mean ± s.d., n = 6). (C,D) Shear stress resistance measurements (mean ± s.d., n = 6). Assays were carried out 2 hr (B,C) or 24 hr (D) after plating of cells.
Figure 5
Figure 5
Impairment of db-cAMP-induced morphological differentiation of plectin-deficient astroglial cells. (A–D) Immunofluorescence microscopy of GFAP IF networks in 6-day-old primary astroglial cells derived from plectin+/+ and plectin−/− mouse brain, after incubation with (C,D) or without (A,B) 1 mm db-cAMP for 6 hr. Note stellate morphology with long protrusions in db-cAMP-treated normal astroglial cells (C, arrowheads), compared to more regular and flat appearance of plectin-deficient astroglia with hardly any processes (D). Bar, 20 μm. (E) Quantification (mean ± s.d., n = 10) of differentiation after 6 hr treatment with 1 mm db-cAMP. (Shaded bar) Plectin+/+; (open bar) plectin−/−.
Figure 5
Figure 5
Impairment of db-cAMP-induced morphological differentiation of plectin-deficient astroglial cells. (A–D) Immunofluorescence microscopy of GFAP IF networks in 6-day-old primary astroglial cells derived from plectin+/+ and plectin−/− mouse brain, after incubation with (C,D) or without (A,B) 1 mm db-cAMP for 6 hr. Note stellate morphology with long protrusions in db-cAMP-treated normal astroglial cells (C, arrowheads), compared to more regular and flat appearance of plectin-deficient astroglia with hardly any processes (D). Bar, 20 μm. (E) Quantification (mean ± s.d., n = 10) of differentiation after 6 hr treatment with 1 mm db-cAMP. (Shaded bar) Plectin+/+; (open bar) plectin−/−.
Figure 6
Figure 6
Binding of plectin to actin is influenced by PIP2. (A) SDS-PAGE of purified plectin fragments containing the ABD. ABD/2–6, ABD/1b–24, and ABD/1–24, fragments corresponding to plectin exons 2–6 (human), 1b–24 (rat), and 1–24 (rat), respectively. Positions of molecular mass markers are indicated. (B–D) Purified His-tagged recombinant plectin fragments were coated onto microtiter plates at concentrations of 50–500 nm (B) and 500 nm (C,D), and overlaid with Eu3+-labeled G-actin at concentrations of 100 nm (B,C) and 0–800 nm (D). Data are presented as the mean ± s.d. of triplicate determinations. (B) Overlay assay of ABD/2–6 and recombinant plectin fragments lacking the ABD [PleR–4, Ple–R5, Ple–R5(ANAA)]. Data have been corrected for nonspecific binding to BSA. (C) Recombinant proteins ABD/1–24, ABD/1b–24, ABD/2–6, and BSA (negative control) immobilized on microtiter plates were preincubated with 0, 8.5, and 42 μg/mL PIP2 for 1 hr before being overlaid with Eu3+-labeled G-actin. Note strong reduction of plectin–actin binding in the presence of PIP2. (D) Concentration-dependent binding of actin to ABD/1–24.
Figure 6
Figure 6
Binding of plectin to actin is influenced by PIP2. (A) SDS-PAGE of purified plectin fragments containing the ABD. ABD/2–6, ABD/1b–24, and ABD/1–24, fragments corresponding to plectin exons 2–6 (human), 1b–24 (rat), and 1–24 (rat), respectively. Positions of molecular mass markers are indicated. (B–D) Purified His-tagged recombinant plectin fragments were coated onto microtiter plates at concentrations of 50–500 nm (B) and 500 nm (C,D), and overlaid with Eu3+-labeled G-actin at concentrations of 100 nm (B,C) and 0–800 nm (D). Data are presented as the mean ± s.d. of triplicate determinations. (B) Overlay assay of ABD/2–6 and recombinant plectin fragments lacking the ABD [PleR–4, Ple–R5, Ple–R5(ANAA)]. Data have been corrected for nonspecific binding to BSA. (C) Recombinant proteins ABD/1–24, ABD/1b–24, ABD/2–6, and BSA (negative control) immobilized on microtiter plates were preincubated with 0, 8.5, and 42 μg/mL PIP2 for 1 hr before being overlaid with Eu3+-labeled G-actin. Note strong reduction of plectin–actin binding in the presence of PIP2. (D) Concentration-dependent binding of actin to ABD/1–24.
Figure 7
Figure 7
Transfection of cDNAs encoding full-length plectin (A,B) or the amino-terminal plectin fragment ABD/1a–14 (C–G) into plectin−/− fibroblast cells. (A–F) Double immunofluorescence microscopy was carried out 6 hr post-transfection using primary antibodies as indicated; expression plasmids used were pBN60 (A,B) and pBK23 (C–F). Note that the staining pattern of full-length plectin in the two transfected cells visualized in A (arrowheads) would hardly be distinguishable from that of the collapsed IF network (not shown) in these cells. Furthermore, expression of both full-length plectin (A,B) and ABD/1a–14 (C–F) clearly correlates with a decrease of actin stress fibers in transfected cells (B, arrowheads; C,D, cells 1 and 2) compared to untransfected cells (B, arrow; D, cell 3). Numerous plectin+/+ cell protrusions in cells transfected with ABD/1a–14 (C,E, small arrowheads) are missing in full-length plectin-transfected cells (cf. A with C and D). Note also, codistribution of ABD/1a–14 and actin at peripheral structures and protrusions (C–F, large arrowheads) and remaining stress fibers (E,F, arrows). (G) Numerical analysis of actin stress fibers in plectin−/− (•) and ABD/1a–14-transfected cells (□). Data points represent individual cells. Note higher number of actin stress fibers in plectin-deficient cells compared to ABD/1a–14-expressing cells of similar size. Bar, 30 μm.

References

    1. Andrä K, Lassmann H, Bittner R, Shorny S, Fässler R, Propst F, Wiche G. Targeted inactivation of plectin reveals essential function in maintaining integrity of skin, muscle, and heart cytoarchitecture. Genes & Dev. 1997;11:3143–3156. - PMC - PubMed
    1. Bershadsky A, Chausovsky A, Becker E, Lyubimova A, Geiger B. Involvement of microtubules in the control of adhesion-dependent signal transduction. Curr Biol. 1996;6:1279–1289. - PubMed
    1. Chavanas S, Pulkkinen L, Gache Y, Smith FJD, McLean WHI, Uitto J, Ortonne JP, Meneguzzi G. A homozygous nonsense mutation in the PLEC1 gene in patients with epidermolysis bullosa simplex with muscular dystrophy. J Clin Invest. 1996;98:2196–2200. - PMC - PubMed
    1. Cunningham CC, Stossel TP, Kwiatkowski DJ. Enhanced motility in NIH 3T3 fibroblasts that overexpress gelsolin. Science. 1991;251:1233–1236. - PubMed
    1. Cunningham CC, Gorlin JB, Kwiatkowski DJ, Hartwig JH, Janmey PA, Byers HR, Stossel TP. Actin-binding protein requirement for cortical stability and efficient locomotion. Science. 1992;255:325–327. - PubMed

Publication types

MeSH terms