. 1998 Nov 1;12(21):3452-63.
doi: 10.1101/gad.12.21.3452.

The ovo gene required for cuticle formation and oogenesis in flies is involved in hair formation and spermatogenesis in mice

Affiliations

The ovo gene required for cuticle formation and oogenesis in flies is involved in hair formation and spermatogenesis in mice

X Dai et al. Genes Dev. .

Abstract

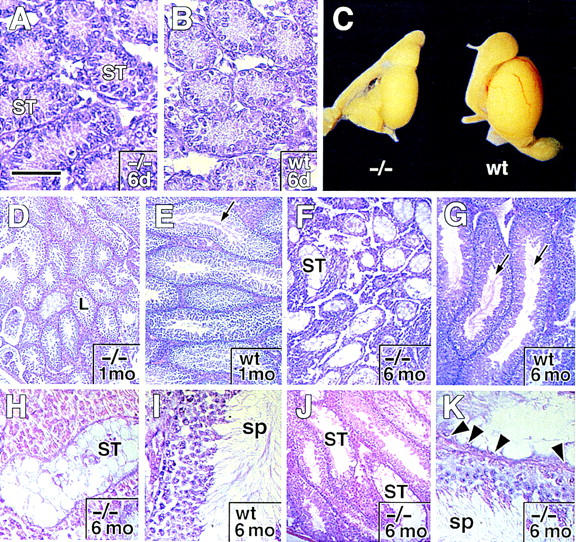
The Drosophila svb/ovo gene gives rise to differentially expressed transcripts encoding a zinc finger protein. svb/ovo has two distinct genetic functions: shavenbaby (svb) is required for proper formation of extracellular projections that are produced by certain epidermal cells in late-stage differentiation; ovo is required for survival and differentiation of female germ cells. We cloned a mouse gene, movo1 encoding a nuclear transcription factor that is highly similar to its fly counterpart in its zinc-finger sequences. In mice, the gene is expressed in skin, where it localizes to the differentiating cells of epidermis and hair follicles, and in testes, where it is present in spermatocytes and spermatids. Using gene targeting, we show that movo1 is required for proper development of both hair and sperm. movo1(-/-) mice are small, produce aberrant hairs, and display hypogenitalism, with a reduced ability to reproduce. These mice also develop abnormalities in kidney, where movo1 is also expressed. Our findings reveal remarkable parallels between mice and flies in epidermal appendage formation and in germ-cell maturation. Furthermore, they uncover a phenotype similar to that of Bardet-Biedl syndrome, a human disorder that maps to the same locus as human ovo1.


Figures

Figure 1
Figure 1
Examining movo1 in skin and ovary. (A) Northern analysis of skin and ovary RNAs, loaded at 2 μg of polyA+RNA per lane. Transcripts hybridizing with the movo1 and GAPDH (control) probes are shown. (B–E) In situ hybridizations of digoxygenin-labeled movo1 cRNA on embryonic skin from E13.5 to E16.5. In C, the developing epidermis at the embryo’s arm–body junction is shown. (F) In situ hybridizations of movo1 probe on newborn back skin. (E) Ectoderm; (S) suprabasal layers; (B) basal layer. Broken lines denote basement membrane. Arrows denote hybridizing signals in precortical cells of hair follicles. Bar, 50 μm in B–E; 80 μm in F.
Figure 2
Figure 2
Northern analysis of RNAs isolated from mouse keratinocytes cultured in the presence of 1.2 mm Ca2+ for the hours (hr) indicated. Twenty micrograms of total RNAs was loaded in each lane. The same blot was stripped and rehybridized with the probes indicated.
Figure 3
Figure 3
Nuclear localization of mOvo1a in transfected Cos cells. (A) Coomassie blue staining of SDS-PAGE-resolved proteins from Cos cells transfected with empty vector (−) or with CMV–movo1a (+). (B) Anti-mOvo1 immunoblot analysis of same extracts in A. Chemiluminescence was used to visualize the signal. Major band is at 30 kD. (C) Anti-mOvo1 immunoblot analysis of nuclear extracts prepared from Cos cells transfected as in A. Note: The minor ∼25-kD band is a degradation product of the full-length protein as its presence in repeated experiments was variable. (D,E) Anti-mOvo1 (green) and DAPI (blue) immunofluorescence of Cos cells transfected with CMV–movo1a. Note: Anti-mOvo1 labeling restricted to the nuclei of transfected cells. Bar, 50 μm in D and E.
Figure 4
Figure 4
Tissue-specific expression of movo1 RNAs. Poly(A)+–RNAs were hybridized with a movo1-specific probe (top). The blot was then stripped and rehybridized with a GAPDH probe (bottom). The sizes of the three movo1 transcripts are indicated at the right.
Figure 5
Figure 5
Disruption of movo1 gene in ES cells and in mice. (A) Stick diagrams of the movo1 locus (top), targeting vector (middle), and mutant locus resulting from homologous recombination (bottom). Exons (E1–E4) are shown as boxes above the wild-type allele. Translation initiation codon (ATG) and stop codon (TGA) are as indicated; shaded segments denote zinc finger domains. Black bars denote 5′ and 3′ probes used for Southern blot analysis; hatched boxes denote movo1 sequences used for arms. (Bg) BglII; (X) XbaI; (H) HindIII; (E) EcoRI; (Pv2) PvuII; (Pv) PvuI; (P) PstI; (S) SalI; (Sm) SmaI; (Xh) XhoI. (B–D) Southern blot analyses of genomic DNAs from representative ES clones (B, 5′ probe; C, 3′ probe) and mouse tails (D, 3′ probe). DNAs were digested with XbaI–XhoI (B), HindIII (C), or PvuII (D). (E) PCR analysis of genomic DNAs from mouse tails. The pair of primers denoted by black arrows in A generated a 2.5-kb product diagnostic for homologous recombination (ko band). The pair of primers denoted by white arrows in A generated a 330-bp product unique for the wild-type allele (wt band). (F) RT–PCR analysis of total RNAs isolated from skin and kidney of movo1+/+, movo1+/−, and movo1−/− mice. Set of primers used generated a band corresponding to the targeted zinc finger domains of movo1. Actin primers were used as an internal control.
Figure 5
Figure 5
Disruption of movo1 gene in ES cells and in mice. (A) Stick diagrams of the movo1 locus (top), targeting vector (middle), and mutant locus resulting from homologous recombination (bottom). Exons (E1–E4) are shown as boxes above the wild-type allele. Translation initiation codon (ATG) and stop codon (TGA) are as indicated; shaded segments denote zinc finger domains. Black bars denote 5′ and 3′ probes used for Southern blot analysis; hatched boxes denote movo1 sequences used for arms. (Bg) BglII; (X) XbaI; (H) HindIII; (E) EcoRI; (Pv2) PvuII; (Pv) PvuI; (P) PstI; (S) SalI; (Sm) SmaI; (Xh) XhoI. (B–D) Southern blot analyses of genomic DNAs from representative ES clones (B, 5′ probe; C, 3′ probe) and mouse tails (D, 3′ probe). DNAs were digested with XbaI–XhoI (B), HindIII (C), or PvuII (D). (E) PCR analysis of genomic DNAs from mouse tails. The pair of primers denoted by black arrows in A generated a 2.5-kb product diagnostic for homologous recombination (ko band). The pair of primers denoted by white arrows in A generated a 330-bp product unique for the wild-type allele (wt band). (F) RT–PCR analysis of total RNAs isolated from skin and kidney of movo1+/+, movo1+/−, and movo1−/− mice. Set of primers used generated a band corresponding to the targeted zinc finger domains of movo1. Actin primers were used as an internal control.
Figure 6
Figure 6
Morphology and biochemistry of movo1−/− back skin. Back skins of a newborn movo1−/− mouse and control littermate (wt) were processed for histology and immuofluorescence microscopy. (A–D) Hematoxylin- and eosin-stained sections. (E) Immunofluorescence assay for transglutaminase (Tg) activity in movo1−/− back skin. (F,G) Immunofluorescence staining of movo1−/− back skin with antibodies to loricrin (Lor, F) and hair keratins (hair ker, G). Immuofluorescence patterns were indistinguishable from wild type (not shown). Broken lines denote basement membrane. Bar, 160 μm in A and B; 40 μm in C and D; 110 μm in E and G; 30 μm in F.
Figure 7
Figure 7
Aberrant hair coat of the movo1−/− mice. (A) movo1−/− mouse (top) and control littermate (bottom). (B) Close-up of the back area from mutant (left) and control (right) mice.
Figure 8
Figure 8
Scanning electron microscopy of skin surface from movo1 mutant and control mice. Back skins are from similar regions of an 8-day-old mutant mouse (B,C) and control littermate (A). Arrowheads in C denote splits at the hair ends. (D) Higher magnification of a mutant hair from the movo1 mouse to reveal intercellular nature of the split. Bar, 100 μm in A–C; 10 μm in D.
Figure 9
Figure 9
movo1 expression in kidney and effect of movo1 ablation on kidney morphology. (A,B) In situ hybridizations of movo1 (A) or sense (B) probe on frozen sections of adult kidney. Note hybridizing signals in kidney tubules but not in glomeruli (G). (C,D) Kidneys from a 6-day-old mutant mouse (C) and littermate (D). (E,F) Kidneys from a 3-month-old mutant mouse (E) and littermate (F). Asterisks (*) denote cysts in mutant kidneys not to be confused with tubule lumens (Lu). Bar, 75 μm.
Figure 10
Figure 10
movo1 RNA expression in testis. In situ hybridizations of movo1 (A and C) or sense (B) probes on frozen sections of adult testis. Note hybridization in germ cells of seminiferous tubules. Hybridization was not detected in spermatogonia (Sg), but was prominent in spermatocytes (Sc). (Lu) Lumen; (Sp) spermatids. Bar, 60 μm in C; 200 μm in A and B.
Figure 11
Figure 11
Morphological abnormalities in the movo1 mutant testes. Shown are hematoxylin- and eosin-stained sections of representative testes from movo1−/− mice and control littermates (wt) at ages indicated. Whole testes are from 1-month-old mice; corresponding sections of these tissues reveal a dramatic difference in the size of the developing seminiferous tubules (D and E are at same magnification). Note the presence of sperm (arrows, SP) in lumen of mature wild-type, but not in most mutant, seminiferous tubules (ST). (K) Section of testis from mutant mouse that fathered five litters. The upper tubule was typical of movo1−/− testes: Arrowheads denote a few spermatogonia left in an otherwise degenerated seminiferous tubule; often only Sertoli cells remained. movo1−/− tubule in lower part of frame K displayed normal-looking sperm. Bar, 55 μm in A and B; 6.5 mm in C; 280 μm in D and E; 240 μm in F, G, and J; 60 μm in K.
Figure 12
Figure 12
Schematic diagram of the fly and mouse epidermis. (A) Fly larval epidermis is composed of a single layer of cells. These cells are arranged in a specific spatial pattern such that those that make denticles alternate with those that do not. Denticle formation occurs late in larval development, and stems from epithelial protrusions, hardened by cuticle secretion. (B) Mouse epidermis and hair follicles arise from a single-layered embryonic ectoderm. In the adult, the epidermis is composed of a single layer of mitotically active basal cells and multiple layers of terminally differentiating suprabasal cells. The hair follicle is more complex. The cellular hair shaft arises from upward differentiation of matrix cells into precortex cells and finally into the cortex and medulla. It is encased by two cellular root sheaths, the outermost of which is contiguous with the epidermis.

References

    1. Allen E, Yu Q-C, Fuchs E. Abnormalities in desmosomes, proliferation and differentiation in the epidermis of mice expressing a mutant desmosomal cadherin. J Cell Biol. 1996;133:1367–1382. - PMC - PubMed
    1. Andrews J, Levenson I, Oliver B. New AUG initiation codons in a long 5′ UTR create four dominant negative alleles of the Drosophila C2H2 zinc-finger gene ovo. Dev Genes Evol. 1998;207:482–487. - PubMed
    1. Beales PL, Warner AM, Hitman GA, Thakker R, Flinter FA. Bardet-Biedl syndrome: A molecular and phenotypic study of 18 families. J Med Genet. 1997;34:92–98. - PMC - PubMed
    1. Bogan JS, Page DC. Ovary? Testis?—A mammalian dilemma. Cell. 1994;76:603–607. - PubMed
    1. Busson D, Gans M, Komitopoulou K, Masson M. Genetic analysis of three dominant female sterile mutations located on the X-chromosome of Drosophila melanogaster. Genetics. 1983;105:309–325. - PMC - PubMed

Publication types

MeSH terms