. 1998 Nov;118(3):907-16.
doi: 10.1104/pp.118.3.907.

Acid-growth response and alpha-expansins in suspension cultures of bright yellow 2 tobacco

Collaborators, Affiliations

Acid-growth response and alpha-expansins in suspension cultures of bright yellow 2 tobacco

B M Link et al. Plant Physiol. 1998 Nov.

Abstract

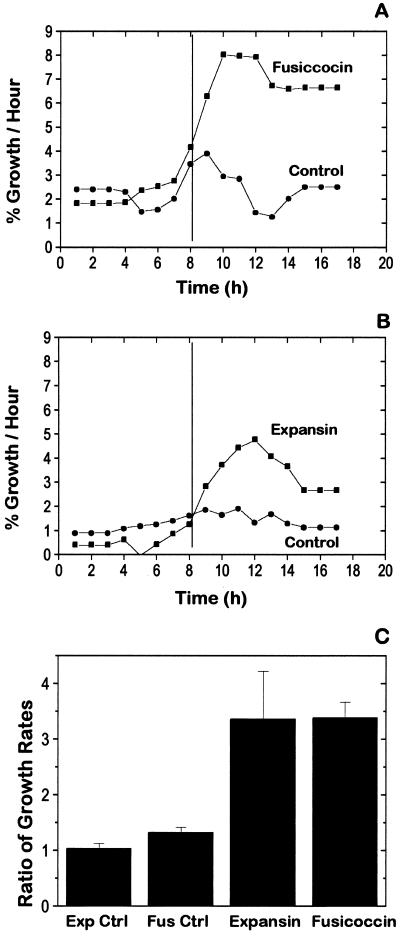
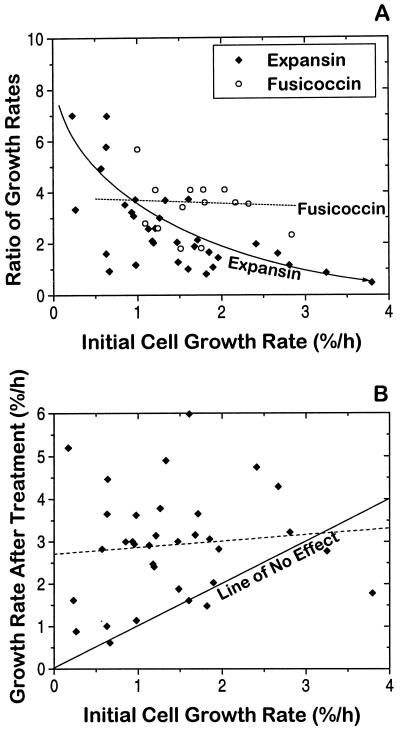
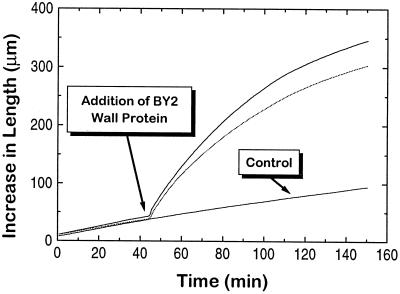
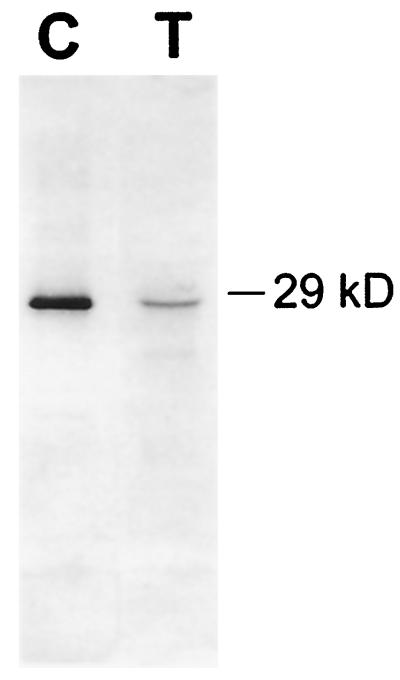
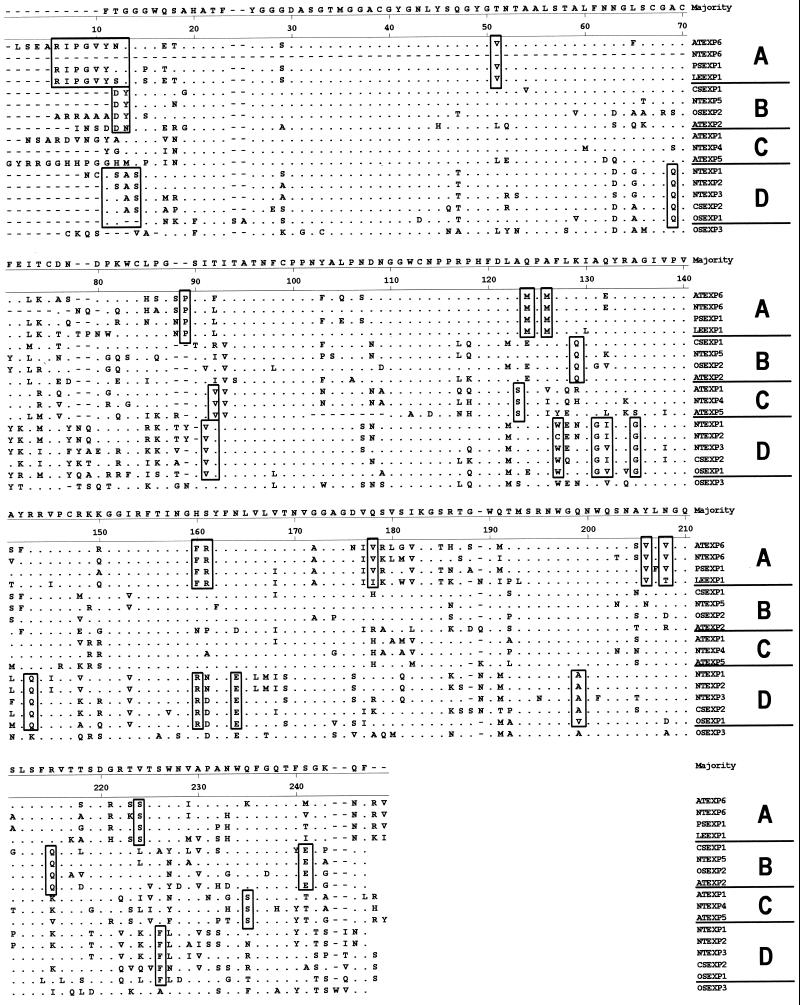
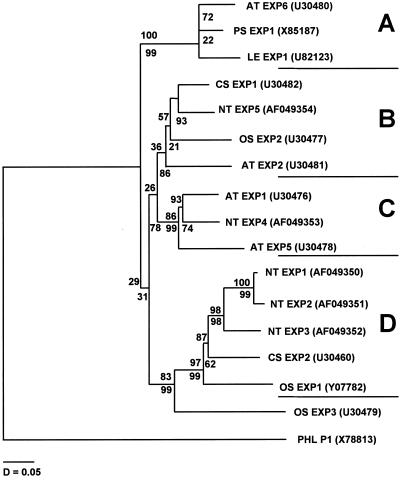
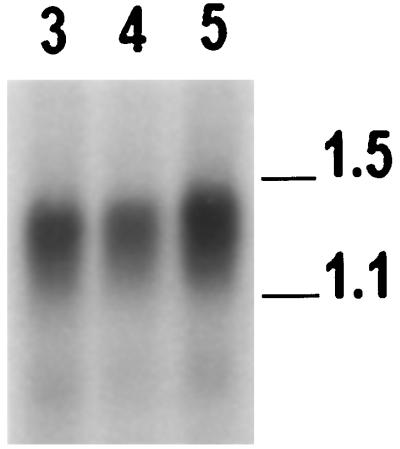
The possibility that Bright Yellow 2 (BY2) tobacco (Nicotiana tabacum L.) suspension-cultured cells possess an expansin-mediated acid-growth mechanism was examined by multiple approaches. BY2 cells grew three times faster upon treatment with fusicoccin, which induces an acidification of the cell wall. Exogenous expansins likewise stimulated BY2 cell growth 3-fold. Protein extracted from BY2 cell walls possessed the expansin-like ability to induce extension of isolated walls. In western-blot analysis of BY2 wall protein, one band of 29 kD was recognized by anti-expansin antibody. Six different classes of alpha-expansin mRNA were identified in a BY2 cDNA library. Northern-blot analysis indicated moderate to low abundance of multiple alpha-expansin mRNAs in BY2 cells. From these results we conclude that BY2 suspension-cultured cells have the necessary components for expansin-mediated cell wall enlargement.


Figures

Figure 1
Figure 1
Microscope image of a typical BY2 cell group showing how measurements were made. Images of cell groups were recorded once an hour on videotape. At the end of an experiment the images were captured by a graphics board and National Institutes of Health Image software was used to trace outlines of cell groups and to calculate the area inside of the perimeter. All growth data are expressed as percent change in an optical cross-sectional area. The trace on the right image shows how lengths were measured. Scale bars = 100 μm.
Figure 2
Figure 2
Effect of fusicoccin or expansin on growth rates of BY2 cells. Individual growth-rate data (based on optical cross-sectional areas) for four sets of cells in a growth assay were averaged to produce a single growth-rate curve for the experiment. Five-point Savitsky-Golay smoothing was used to reduce the noise inherent in rate data. This accounts for the apparent spreading of the growth response to times preceding treatment. A, At 8 h, cells were treated with either 1 μL of fusicoccin (final concentration 500 nm) or an equivalent amount of ethanol (control treatment). B, At 8 h, cells were treated either with approximately 20 μg of C3 cucumber expansin (1 μg/μL) in 50 mm sodium acetate, pH 4.5, or with an equivalent amount of sodium acetate (controls). C, Bar chart comparing the average ratio (growth rate for the 8-h period after treatment divided by the growth rate for the 8-h period before treatment) and se for all experiments. The average growth rates before treatments were: expansin controls (Exp Ctrl), 1.60%/h (se = 0.12%/h, n = 35); fusicoccin controls (Fus Ctrl), 1.96%/h (se = 0.22%/h, n = 15); expansin, 1.36%/h (se = 0.15%/h, n = 35); and fusicoccin, 1.71%/h (se = 0.51%/h, n = 14).
Figure 3
Figure 3
Fusicoccin- and expansin-growth responses as a function of initial growth rate. A, Growth response as a function of pretreatment growth rate. The increase in growth rates for cell groups (growth rate after treatment divided by growth rate before treatment) was plotted against the initial (pretreatment) growth rate. The solid and dotted lines represent least-squares fits for the expansin and fusicoccin data, respectively. The line for the expansin data is an exponential decay fit. The dashed line for the fusicoccin data is a first-order fit. B, The growth rate after treatment with expansins is plotted against the pretreatment growth rate. The solid diagonal line (slope = 1) represents where the data would fall if expansin treatment had no effect. The dashed line is a least-squares fit of the data and has a slope of 0.145 ± 0.252, and a y intercept of 2.71%/h. All growth rates were based on change in the optical cross-sectional area versus time.
Figure 4
Figure 4
Results of extension assays using wall protein extracted from BY2 cells. Heat-inactivated wall specimens from cucumber hypocotyls were placed in the extensometer under 20 g of tension, and bathed in 200 μL of 50 mm sodium acetate at pH 4.5. Their initial creep rates were recorded for 45 min, after which time the buffer for two of the cuvettes was replaced with 200 μL of the BY2 wall protein extract, which was resuspended in 50 mm sodium acetate at pH 4.5. Total wall protein concentration was approximately 170 μg/mL. Initial length of the wall sample was 5 mm. Extension assays were done on four separate occasions with similar results.
Figure 5
Figure 5
Western blot of partially purified cucumber and tobacco cell wall proteins probed with antibodies to cucumber α-expansin. Wall proteins from the expansin-containing fractions of an HPLC C3 hydrophobic interactions column were electrophoresed into a 15% SDS-PAGE gel, blotted, and cross-reacted with a polyclonal antibody raised against cucumber S1 α-expansin (Li et al., 1993). Lane C, One microgram of cucumber hypocotyl wall protein; lane T, 10 μg of tobacco proteins. Western-blot analysis was done on five separate occasions with similar results.
Figure 6
Figure 6
Amino acid alignment of previously published expansin sequences with predicted sequences from the tobacco cDNAs. Areas with dots are identical to the consensus sequence, and dashes are used to indicate gaps in the alignment. The order of sequences matches the order on the phylogenetic tree in Figure 7. The large letters along the right margin indicate the α-expansin subfamily shown in Figure 7. Changes in amino acids that appear to be conserved among subfamilies are boxed. The sequence for NTEXP6 is missing at least the first 60 amino acids. Dashes were inserted in this area to align it with the other sequences.
Figure 7
Figure 7
Phylogenetic tree based on the nucleotide sequences and the alignment of expansins presented in Figure 6. The third position of each codon was excluded, because it is likely to be saturated with mutations. The tree was produced by the MEGA program using the neighbor-joining method, with Kimura two-parameter distances with the complete deletion option. Bootstrap values are given above the branches and confidence probability values are indicated below. The tree was rooted using Phleum pollen allergen (PHL P1). Accession numbers are given after the gene names. The names are given according to our current naming convention, in which the letters EXP designate expansin and the first two letters indicate the genus and species: AT for Arabidopsis, CS for cucumber (Cucumis sativus), LE for tomato (Lycopersicon esculentum), NT for tobacco (Nicotiana tabacum), OS for rice (Oryza sativa), and PS for pea (Pisum sativum). Lengths of the branches represent nucleotide distances.
Figure 8
Figure 8
Northern-blot analysis of BY2 mRNA. Two micrograms of BY2 poly(A+) RNA was loaded for each lane. The blot was probed with a probe made to the full-length NTEXP1 cDNA. The numbers above the lanes indicate the ages of the cells in days. The numbers on the right indicate the sizes of the RNAs in kilobases. Northern-blot analysis was repeated on at least five separate occasions with similar results.

References

    1. Akehurst BC (1970) The botany, genetics and the development of commercial types. In D Rhind, ed, Tobacco, Ed 2. Longham Group, London, pp 42–61
    1. Cabot EL, Beckenbach AT. Simultaneous editing of multiple nucleic acid and protein sequences with ESEE. Comput Appl Biosci. 1989;5:233–234. - PubMed
    1. Carpita NC, Gibeaut DM. Structural models of primary cell walls in flowering plants: consistency of molecular structure with the physical properties of the walls during growth. Plant J. 1993;3:1–30. - PubMed
    1. Cho HT, Kende H. Expression of expansin genes is correlated with growth in deepwater rice. Plant Cell. 1997;9:1661–1671. - PMC - PubMed
    1. Cosgrove DJ. Wall relaxation and the driving forces for cell expansive growth. Plant Physiol. 1987;84:561–564. - PMC - PubMed

Publication types

LinkOut - more resources