. 1998 Dec;72(12):9698-705.
doi: 10.1128/JVI.72.12.9698-9705.1998.

Human immunodeficiency virus induces a dual regulation of Bcl-2, resulting in persistent infection of CD4(+) T- or monocytic cell lines

Affiliations

Human immunodeficiency virus induces a dual regulation of Bcl-2, resulting in persistent infection of CD4(+) T- or monocytic cell lines

F Aillet et al. J Virol. 1998 Dec.

Abstract

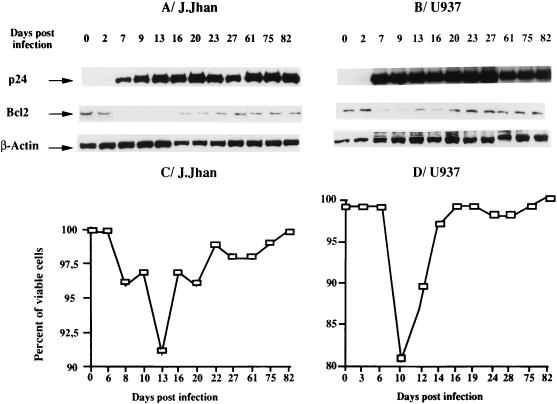
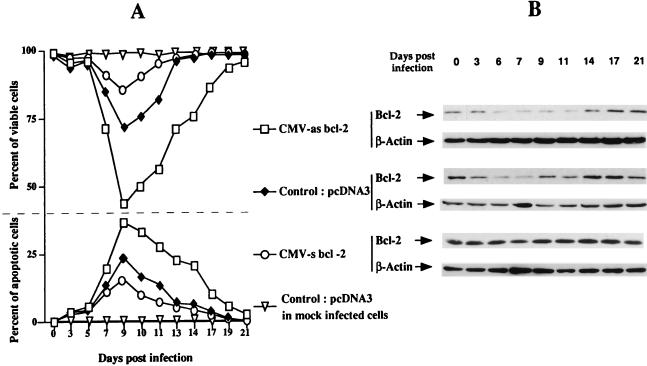
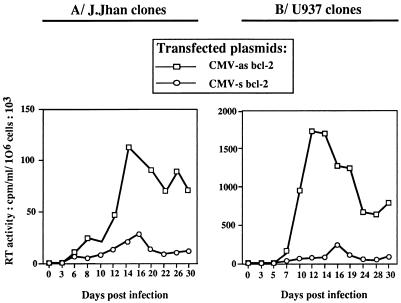
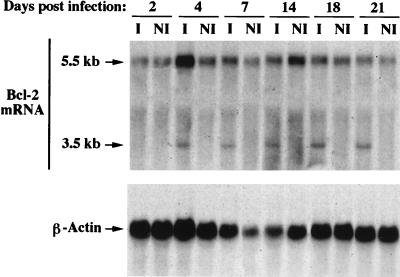
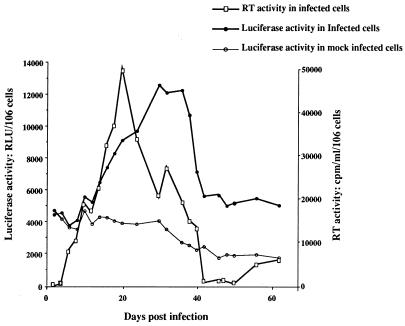
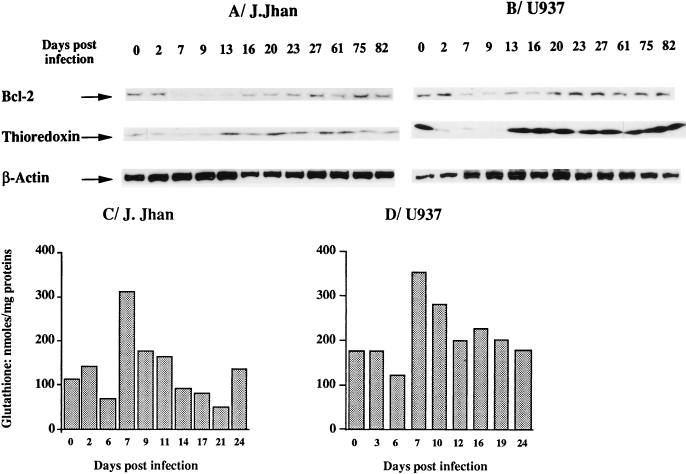
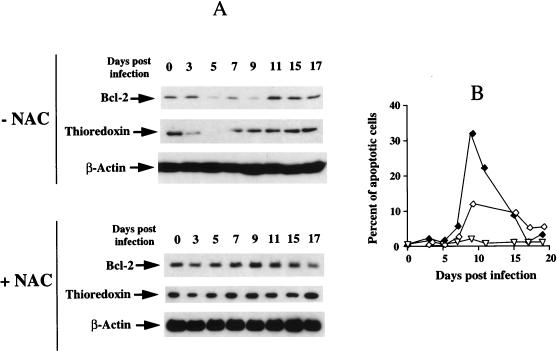
This work aims at characterizing the interplay between human immunodeficiency virus type 1 (HIV-1) and the antiapoptotic cellular protein Bcl-2 responsible for a persistent infection in lymphoblastoid T (J.Jhan) or monocytic (U937) cells. We report that the kinetics of Bcl-2 protein level during the establishment of a chronic infection is biphasic, characterized by a transient decrease followed by restoration to the initial level. The extent and duration of this transient decrease were inversely correlated with the basal level of Bcl-2 as shown by kinetics of Bcl-2 levels in J. Jhan or U937 clones exhibiting different levels of Bcl-2. Using these clones, we also showed that Bcl-2 downregulates HIV-1 replication. Therefore, the cells overexpressing Bcl-2 are characterized by a low viral burden which, in turn, has little effect on the level of this protein. The observed bipasic kinetics is the result of a dual regulation of Bcl-2 induced by HIV-1 infection itself: an upregulation at the transcriptional level of the bcl-2 gene concomitant with a downregulation at the protein level. Convergent data suggest that this downregulation is caused by the oxidative stress induced by the infection itself as shown by the associated modulations of glutathione and thioredoxin levels and by the prevention of these dysregulations by N-acetylcysteine. Altogether, these data indicate that infection first results in a decrease of Bcl-2, permitting an initial boost of replication. Then, as the synthesis at the transcriptional level proceeds, the replication is negatively controlled by Bcl-2 to reach a balance characterized by low virus production and a level of Bcl-2 compatible with cell survival. We suggest that the basal level of Bcl-2, together with infection-inducible transcription factors able to activate bcl-2 gene transcription, is a critical cellular determinant in the tendency toward an acute or a persistent infection.


Figures

FIG. 1
FIG. 1
Kinetics of the level of Bcl-2 over the course of HIV-1 infection in the lymphoblastoid T-cell (J.Jhan) (A) and monocytic cell (U937) (B) lines. Levels of Bcl-2 were analyzed by Western immunoblot analysis at various times postinfection. In parallel, p24gag antigen expression was also evaluated as a criterion of viral protein expression. The level of β-actin was also determined to standardize the amount of proteins used. In parallel, the percentage of viable cells was determined by trypan blue exclusion (C and D). The data shown here are representative of two independent experiments.
FIG. 2
FIG. 2
Percentages of viable and apoptotic cells (A) in J.Jhan clones exhibiting distinct basal levels of Bcl-2 (B) over the course of HIV-1 infection. Levels of Bcl-2 were determined by Western immunoblot analysis in J.Jhan cells stably transfected with either CMV-as bcl-2, control pcDNA3, or CMV-s bcl-2 vectors at different times postinfection. The level of β-actin, as a nonantioxidant protein, was also determined to standardize the amount of proteins used. In parallel, the rate of apoptosis was determined by the TUNEL technique as described in Materials and Methods. The percentage of viable cells was determined by trypan blue exclusion. Percentages of apoptosis and viability were also determined in mock-infected J.Jhan cells transfected with pcDNA3.
FIG. 3
FIG. 3
Comparative kinetics of HIV-1 replication in J.Jhan or U937 clones exhibiting distinct basal levels of Bcl-2. HIV-1 replication was determined in J.Jhan (A) or U937 (B) cells stably transfected with CMV-as bcl-2 or CMV-s bcl-2 at various times postinfection. HIV-1 replication was evaluated by determination of the RT activity (counts per minute per 106 living cells). The data shown here are representative of two independent experiments.
FIG. 4
FIG. 4
bcl-2 mRNA expression in J.Jhan cells infected or not by HIV-1. Northern blot analysis was performed on J.Jhan cell extracts at different times postinfection (I) or post-mock infection (NI) as described in Materials and Methods. β-Actin probe was used as a control for loading.
FIG. 5
FIG. 5
Modulations of the activity of the P2 promoter of the bcl-2 gene over the course of HIV-1 infection in J.Jhan cells. Luciferase activity was monitored in J.Jhan cells stably cotransfected with P2-luc and pSV2-TK-neo vectors, at various times postinfection. Luciferase activity was determined in cell lysates of infected or mock-infected cells as relative light units (RLU) per 106 cells. In parallel, virus replication was monitored in infected cells by measuring the RT activity in the cell supernatant, expressed in counts per minute per 106 living cells. The data shown here are representative of two independent experiments.
FIG. 6
FIG. 6
Relationship between the dysregulation of Bcl-2 and that of thioredoxin and glutathione over the course of HIV infection. Comparison of the kinetics of thioredoxin and Bcl-2 levels over the course of HIV-1 infection in the lymphoblastoid T-cell (J.Jhan) (A) and monocytic cell (U937) (B) lines. The infection experiment is that represented in Fig. 1. Consequently, data concerning Bcl-2 and β-actin levels were derived from Fig. 1, whereas the thioredoxin level is shown in comparison. Kinetics of glutathione concentrations was determined over the course of HIV-1 infection in the lymphoblastoid T-cell (J.Jhan) (C) and monocytic cell (U937) (D) lines. Glutathione concentrations were determined as described in Materials and Methods and were expressed as nanomoles of reduced glutathione per 106 cells. Each value is the mean of duplicates.
FIG. 7
FIG. 7
NAC counteracts both the decrease of Bcl-2 and thioredoxin and the apoptosis associated with HIV infection. (A) Levels of Bcl-2, thioredoxin, and β-actin were determined by Western immunoblot analysis in the J.Jhan control clone infected and cultured either in the absence (−NAC) or in the presence of 10 mM NAC (+NAC) The level of β-actin was also determined to standardize the amount of proteins used. (B) In parallel, the rate of apoptosis was determined by the YOPRO technique as described in Materials and Methods. Percentages of apoptosis were determined in cells infected in the absence (⧫) or in the presence (◊) of NAC and in mock-infected cells cultured in the presence of NAC (▿).

References

    1. Alonso S, Minty A, Bourlet Y, Buckingham M. Comparison of three actin-coding sequences in the mouse; evolutionary relationships between the actin genes of warm-blooded vertebrates. J Mol Evol. 1986;23:11–22. - PubMed
    1. Ameisen J C, Capron A. Cell dysfunction and depletion in AIDS: the programmed cell death hypothesis. Immunol Today. 1991;12:102–105. - PubMed
    1. Boudet F, Lecoeur H, Gougeon M L. Apoptosis associated with ex vivo down-regulation of Bcl-2 and up-regulation of Fas in potential cytotoxic CD8+ T lymphocytes during HIV infection. J Immunol. 1996;156:2282–2293. - PubMed
    1. Buhl R, Jaffe H A, Holroyd K J, Wells F B, Mastrangeli A, Saltini C, Cantin A M, Crystal R G. Glutathione deficiency and HIV. Lancet. 1990;335:546. . (Letter.) - PubMed
    1. Cameron P, Pope M, Granelli P A, Steinman R M. Dendritic cells and the replication of HIV-1. J Leukoc Biol. 1996;59:158–171. - PubMed

Publication types

MeSH terms