Comparative Study
. 1998 Dec;72(12):10108-17.
doi: 10.1128/JVI.72.12.10108-10117.1998.

CCR5- and CXCR4-utilizing strains of human immunodeficiency virus type 1 exhibit differential tropism and pathogenesis in vivo

Affiliations
Comparative Study

CCR5- and CXCR4-utilizing strains of human immunodeficiency virus type 1 exhibit differential tropism and pathogenesis in vivo

R D Berkowitz et al. J Virol. 1998 Dec.

Abstract

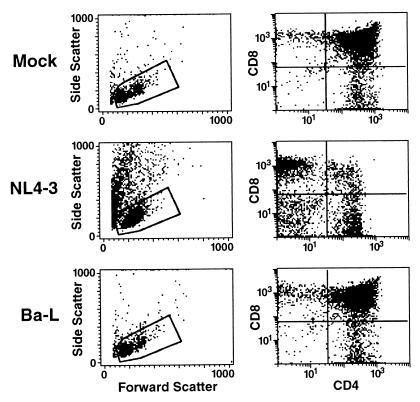
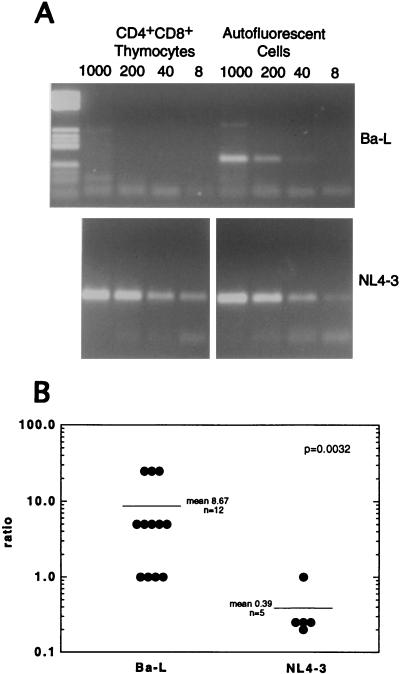
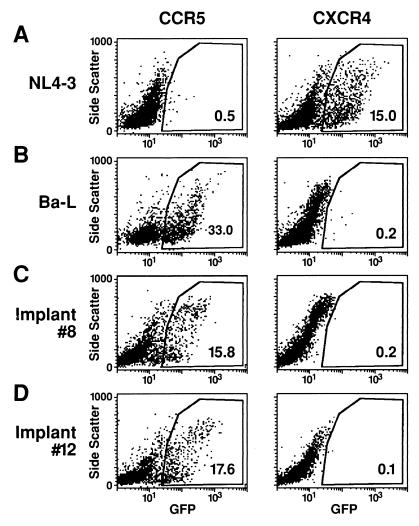
CCR5-utilizing (R5) and CXCR4-utilizing (X4) strains of human immunodeficiency virus type 1 (HIV-1) have been studied intensively in vitro, but the pathologic correlates of such differential tropism in vivo remain incompletely defined. In this study, X4 and R5 strains of HIV-1 were compared for tropism and pathogenesis in SCID-hu Thy/Liv mice, an in vivo model of human thymopoiesis. The X4 strain NL4-3 replicates quickly and extensively in thymocytes in the cortex and medulla, causing significant depletion. In contrast, the R5 strain Ba-L initially infects stromal cells including macrophages in the thymic medulla, without any obvious pathologic consequence. After a period of 3 to 4 weeks, Ba-L infection slowly spreads through the thymocyte populations, occasionally culminating in thymocyte depletion after week 6 of infection. During the entire time of infection, Ba-L did not mutate into variants capable of utilizing CXCR4. Therefore, X4 strains are highly cytopathic after infection of the human thymus. In contrast, infection with R5 strains of HIV-1 can result in a two-phase process in vivo, involving apparently nonpathogenic replication in medullary stromal cells followed by cytopathic replication in thymocytes.


Figures

FIG. 1
FIG. 1
Pathogenesis of Ba-L and NL4-3 in SCID-hu Thy/Liv mice. Dispersed cells from representative SCID-hu Thy/Liv implants inoculated either with medium (top row), NL4-3 (middle row), or Ba-L (bottom row) were analyzed 21 days postinoculation on a FACScan for forward versus side light scatter properties (left). Events falling within the gate corresponding to live cells were subsequently analyzed for expression of CD4 and CD8 (right).
FIG. 2
FIG. 2
Tropism of Ba-L and NL4-3 in SCID-hu Thy/Liv mice. (A to F) Immunohistochemical detection of p24 protein (in red) in representative SCID-hu Thy/Liv implants infected either with NL4-3 for 14 days (A and B) or with Ba-L for 14 (C, D), 42 (E), or 66 (F) days. Thymic cortex containing a relatively dense packing of thymocytes can be distinguished from thymic medulla containing a less dense packing of thymocytes (A and C) and Hassell’s corpuscles (arrows). An isotype control MAb did not stain any cells, indicating that the p24 signal was antigen specific (data not shown). (G and H) Electron microscopic visualization of Ba-L virus particles in regions of cellular debris (G) or in spaces between whole cells (H; at upper right is a thymocyte). Magnifications: ×4 (C), ×10 (A), ×40 (B and D to F), and ×45,000 (G and H).
FIG. 3
FIG. 3
In situ analysis of the medullary stromal cells infected with Ba-L. (A and B) Immunohistochemical detection of p24 protein (A) or CD68 (B) in serial sections from a representative SCID-hu Thy/Liv implant infected with Ba-L for 14 days. Arrows indicate the position of representative p24+ or CD68+ cells. (C to G) Two-color immunohistochemical detection of p24 protein (blue) and either S100 (C and D) or CD68 (E to G; red) from a representative SCID-hu Thy/Liv implant infected with Ba-L for 33 days. Most cells are either blue or red. Infrequent cells colored purple (and which may be Ba-L-infected dendritic cells or macrophages) are marked with arrows. Panel G depicts two adjacent multinucleated CD68+ medullary macrophages, one infected with Ba-L (purple; arrow) and the other uninfected (red). (H) Dark-field image of a representative Ba-L-infected SCID-hu Thy/Liv implant stained for p24 (red). Autofluorescent cells are apparent (yellow); the large yellow object is a Hassel’s corpuscle. Magnification, ×40.
FIG. 4
FIG. 4
Analysis of thymic autofluorescent cells. (A) Flow cytometric analysis of CD11c and HLA-DR expression on autofluorescent SCID-hu Thy/Liv cells with high side scatter. (Left) By using mock channels (25), autofluorescent cells are revealed (within gate). (Middle, top row) Cells were analyzed for staining with a CD11c MAb (y axis) versus a mock channel (x axis). CD11c+ autofluorescent cells were gated and analyzed for HLA-DR expression (right; x axis); 95% of CD11c+ cells were HLA-DR+. (Middle, bottom row) Flow cytometric analysis of the same cells, analyzed for staining with the HLA-DR MAb (x axis) versus a mock channel (y axis). HLA-DR+ autofluorescent cells were gated and analyzed for CD11c expression (right; y axis); 69% of HLA-DR+ cells were CD11c+. (B) Sorted autofluorescent cells were stained for NSE (brown color). (C) Sorted autofluorescent cells were cultured overnight, rinsed, and incubated with 1-μm yellow-green microspheres for 6 h. Adherent cells which phagocytosed the microspheres are visible under dark field.
FIG. 5
FIG. 5
HIV-1 gag PCR analysis of sorted autofluorescent cells and CD4+ CD8+ thymocytes. (A) Autofluorescent cells and CD4+ CD8+ thymocytes from cohort 5 Thy/Liv implants infected with Ba-L (mouse 17) or NL4-3 (mouse 15) were sort purified, lysed, serially diluted, and subjected to PCR using HIV-1 gag-specific primers. The PCR products were resolved by agarose gel electrophoresis and stained with ethidium bromide. (B) The ratios of the frequencies of infection of autofluorescent cells and CD4+ CD8+ thymocytes from 17 HIV-1-infected SCID-hu Thy/Liv implants (Table 3) were plotted and analyzed for statistical significance. The mean ratios were 8.67 for Ba-L-infected implants (n = 12) and 0.39 for NL4-3-infected implants (n = 5), with a Mann-Whitney score of P = 0.0032. Note that cohort 5 NL4-3-infected mouse 15 was not included in the statistical analysis because a PCR band was detected in the reaction containing the greatest dilution of input DNA, preventing estimation of the proviral frequency in CD4+ CD8+ thymocytes.
FIG. 6
FIG. 6
Coreceptor analysis of virus contained within Ba-L-infected Thy/Liv implants. Indicator cell lines expressing either CCR5 or CXCR4 either were infected with NL4-3 or Ba-L virus or were cultured with dispersed cells from cohort 6 Ba-L-infected Thy/Liv implants 8 and 12, as indicated. After 6 days, the indicator cells were harvested and analyzed by flow cytometry for the expression of HIV-1 tat-induced GFP. The percentage of GFP+ cells is indicated inside each plot.

References

    1. Adachi A, Gendelman H E, Koenig S, Folks T, Willey R, Rabson A, Martin M A. Production of acquired immunodeficiency syndrome-associated retrovirus in human and nonhuman cells transfected with an infectious molecular clone. J Virol. 1986;59:284–291. - PMC - PubMed
    1. Ahmad N, Baroudy B M, Baker R C, Chappey C. Genetic analysis of human immunodeficiency virus type 1 envelope V3 region isolates from mothers and infants after perinatal transmission. J Virol. 1995;69:1001–1012. - PMC - PubMed
    1. Aldrovandi G M, Feuer G, Gao L, Jamieson B, Kristeva M, Chen I S, Zack J A. The SCID-hu mouse as a model for HIV-1 infection. Nature. 1993;363:732–736. - PubMed
    1. Berkowitz R D, Beckerman K P, Schall T J, McCune J M. CXCR4 and CCR5 expression delineates targets for HIV-1 disruption of T cell differentiation. J Immunol. 1998;161:3702–3710. - PubMed
    1. Berkowitz, R. D., and J. M. McCune. Unpublished data.

Publication types

MeSH terms

LinkOut - more resources