

Dynamics of fluorescence fluctuations in green fluorescent protein observed by fluorescence correlation spectroscopy
- PMID: 9811841
- PMCID: PMC24860
- DOI: 10.1073/pnas.95.23.13573
Dynamics of fluorescence fluctuations in green fluorescent protein observed by fluorescence correlation spectroscopy
Abstract
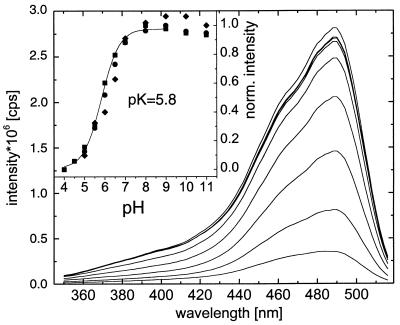
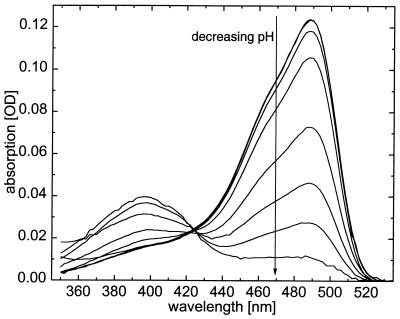
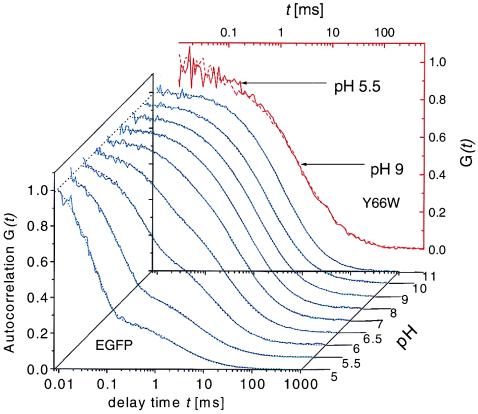
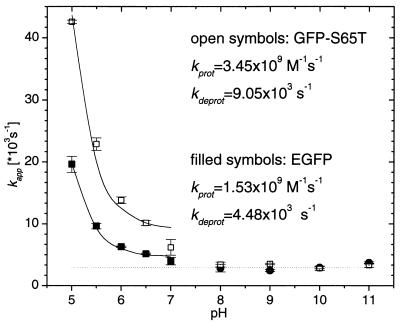
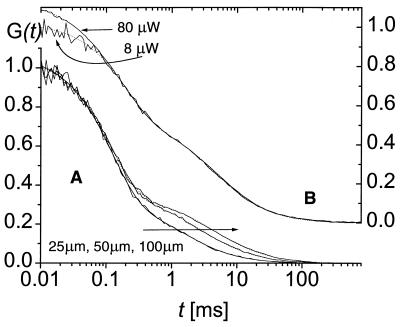
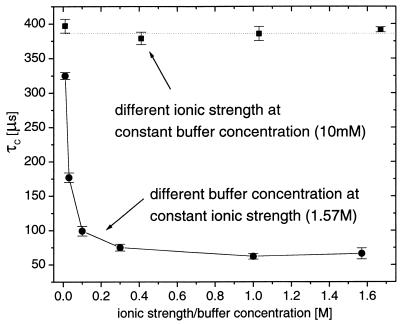
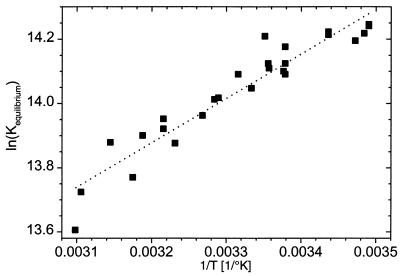
We have investigated the pH dependence of the dynamics of conformational fluctuations of green fluorescent protein mutants EGFP (F64L/S65T) and GFP-S65T in small ensembles of molecules in solution by using fluorescence correlation spectroscopy (FCS). FCS utilizes time-resolved measurements of fluctuations in the molecular fluorescence emission for determination of the intrinsic dynamics and thermodynamics of all processes that affect the fluorescence. Fluorescence excitation of a bulk solution of EGFP decreases to zero at low pH (pKa = 5.8) paralleled by a decrease of the absorption at 488 nm and an increase at 400 nm. Protonation of the hydroxyl group of Tyr-66, which is part of the chromophore, induces these changes. When FCS is used the fluctuations in the protonation state of the chromophore are time resolved. The autocorrelation function of fluorescence emission shows contributions from two chemical relaxation processes as well as diffusional concentration fluctuations. The time constant of the fast, pH-dependent chemical process decreases with pH from 300 microseconds at pH 7 to 45 microseconds at pH 5, while the time-average fraction of molecules in a nonfluorescent state increases to 80% in the same range. A second, pH-independent, process with a time constant of 340 microseconds and an associated fraction of 13% nonfluorescent molecules is observed between pH 8 and 11, possibly representing an internal proton transfer process and associated conformational rearrangements. The FCS data provide direct measures of the dynamics and the equilibrium properties of the protonation processes. Thus FCS is a convenient, intrinsically calibrated method for pH measurements in subfemtoliter volumes with nanomolar concentrations of EGFP.
Figures
References
-
- Misteli T, Spector D L. Nat Biotechnol. 1997;15:961–963. - PubMed
-
- Welsh S, Kay S A. Curr Opin Biotechnol. 1997;8:617–622. - PubMed
-
- Ormö M, Cubitt A B, Kallio K, Gross L A, Tsien R Y, Remington S J. Science. 1996;273:1392–1395. - PubMed
-
- Yang F, Moss L G, Phillips G N., Jr Nat Biotechnol. 1997;14:1246–1251. - PubMed
Publication types
MeSH terms
Substances
LinkOut - more resources
Full Text Sources
Other Literature Sources
