. 1998 Nov 10;95(23):13585-90.
doi: 10.1073/pnas.95.23.13585.

TROSY in triple-resonance experiments: new perspectives for sequential NMR assignment of large proteins

Affiliations

TROSY in triple-resonance experiments: new perspectives for sequential NMR assignment of large proteins

M Salzmann et al. Proc Natl Acad Sci U S A. .

Abstract

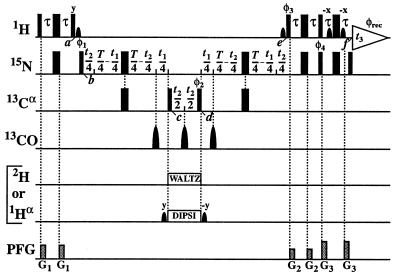
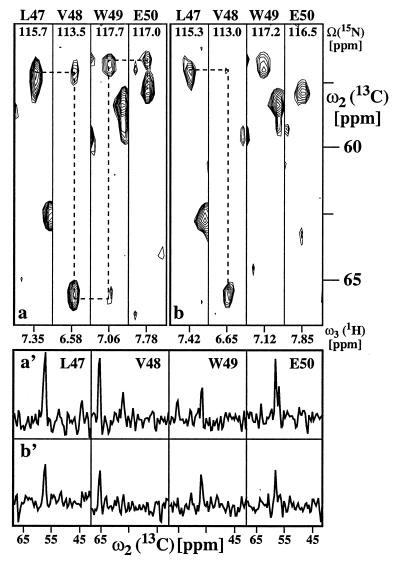
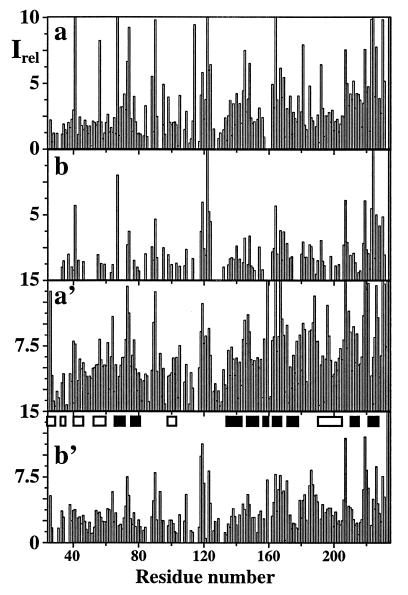
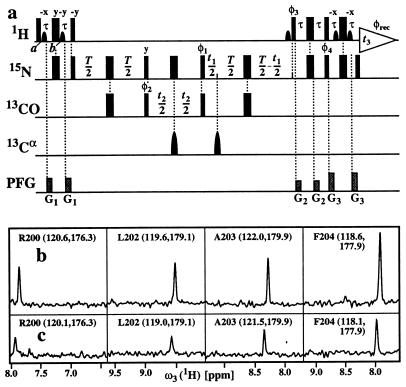
The NMR assignment of 13C, 15N-labeled proteins with the use of triple resonance experiments is limited to molecular weights below approximately 25,000 Daltons, mainly because of low sensitivity due to rapid transverse nuclear spin relaxation during the evolution and recording periods. For experiments that exclusively correlate the amide proton (1HN), the amide nitrogen (15N), and 13C atoms, this size limit has been previously extended by additional labeling with deuterium (2H). The present paper shows that the implementation of transverse relaxation-optimized spectroscopy ([15N,1H]-TROSY) into triple resonance experiments results in several-fold improved sensitivity for 2H/13C/15N-labeled proteins and approximately twofold sensitivity gain for 13C/15N-labeled proteins. Pulse schemes and spectra recorded with deuterated and protonated proteins are presented for the [15N, 1H]-TROSY-HNCA and [15N, 1H]-TROSY-HNCO experiments. A theoretical analysis of the HNCA experiment shows that the primary TROSY effect is on the transverse relaxation of 15N, which is only little affected by deuteration, and predicts sensitivity enhancements that are in close agreement with the experimental data.


Figures

Figure 1
Figure 1
Experimental scheme for the [15N, 1H]-TROSY-HNCA experiment. The radio-frequency pulses on 1H, 15N, 13Cα, 13CO, 2H, and 1Hα are applied at 4.7, 118, 56, 177, 3.6, and 4.7 ppm, respectively. Narrow and wide black bars indicate nonselective 90° and 180° pulses. Sine bell shapes on the lines marked 1H and 1Hα indicate selective 90° pulses. On the line marked 13CO, three selective 180° pulses are applied off-resonance with a duration of 120 μs and a Gaussian shape. The line marked PFG indicates the durations and amplitudes of pulsed magnetic field gradients applied along the z-axis: G1: 800 μs, 15 G/cm; G2: 800 μs, 9 G/cm; and G3: 800 μs, 22 G/cm. The delays are τ = 2.7 ms and T = 44 ms. The phase cycle is: φ1 = {y, −y, −x, x}; φ2 = {4x, 4(−x)}; φ3 = {−y}; φ4 = {−y}; φrec = {y, −y, −x, x, −y, y, x, −x}, with all other radio-frequency pulses applied with phase x. A phase-sensitive spectrum in the 15N(t1) dimension is obtained by recording a second FID for each t1 value, with φ1 = {y, −y, x, −x}, φ3 = {y} and φ4 = {y}, and data processing as described by Kay et al. (41). Quadrature detection in the 13Cα(t2) dimension is achieved by the States-TPPI method (42) applied to the phase φ2. The use of water flip-back pulses (43) at times a and e ensures that the water magnetization stays aligned along +z throughout both the ct period T and the data acquisition period t3. Residual transverse water magnetization is suppressed immediately before data acquisition (44). The scheme is used for two alternative experiments. For 2H-labeled proteins, 2H-decoupling during t2 is achieved with WALTZ-16 composite pulse decoupling (45) at a field strength of γB2 = 2.5 kHz. For measurements with protonated proteins, selective 1Hα-decoupling during the 13Cα(t2) evolution period is applied instead, using a DIPSI-2 decoupling scheme (46) with γB2 = 0.51 kHz. The two selective pulses on the water resonance before and after DIPSI-2 ensure the correct treatment of the water during the subsequent t1 and t2 evolution periods.
Figure 2
Figure 2
Comparison of a [15N, 1H]-TROSY-HNCA recorded with the scheme of Fig. 1 and b conventional HNCA (13) using 1H DIPSI-2 decoupling with γB2 = 3.13 kHz during t1 and t2, and 15N WALTZ-16 decoupling with γB2 = 1.6 kHz during acquisition. Both experiments were recorded with a 1 mM solution of uniformly 2H/13C/15N-labeled gyrase-23B. 26(t1) × 32(t2) × 512(t3) complex points were accumulated, with t1max(15N) = 21.7, t2max(13Cα) = 6.4, and t3max(1H) = 48.7 ms. Fifty-six scans per increment were acquired, resulting in a total measuring time of 38 h per 3D spectrum. Corresponding [ω2(13C),ω3(1H)] strips from the two 3D experiments centered about the 1HN chemical shifts were taken at the 15N chemical shifts of residues 47–50. Because no decoupling during t1 and t3 is used in TROSY, the amide 1HN and 15N resonances in a are shifted in both dimensions by ≈45 Hz relative to the corresponding resonances in b. The sequence-specific assignments are indicated at the top by the one-letter amino acid symbol and the residue number in the amino acid sequence. In both spectra, dashed lines indicate sequential connectivities that could be reliably identified (see text). (a′ and b′) cross sections along the ω2(13C) dimension through the four [ω2(13C),ω3(1H)] strips at the ω3(1H) positions indicated at the bottom in a and b, respectively, where the complete chemical shift range acquired in the ω2(13C) dimension is plotted.
Figure 3
Figure 3
Plots of the relative signal intensities, Irel, along the amino acid sequence of uniformly 2H/13C/15N-labeled gyrase-23B (1 mM protein concentration in 95% H2O/5% D2O at pH 6.5 and T = 20°C). (a) Sequential correlation peaks (ω2(13Ci−1α)/ω3(1HiN)) in [15N, 1H]-TROSY-HNCA. (b) Same as a measured with conventional HNCA (13). (a′) Intraresidual correlation peaks (ω2(13Ciα)/ω3(1HiN)) in [15N, 1H]-TROSY-HNCA. (b′) Same as a′ measured with conventional HNCA. Both spectra were recorded with the same experimental conditions and processed identically, as described in the text. The α-helical and β-sheet regions in the x-ray structure of gyrase-23B (22) are identified in b′ by open and filled bars, respectively.
Figure 4
Figure 4
(a) Experimental scheme for the [15N, 1H]-TROSY-HNCO experiment. All experimental parameters and the phase cycle are the same as in the [15N, 1H]-TROSY-HNCA scheme of Fig. 1. (b and c) Show, respectively, cross sections along the ω3(1H) dimension through four peaks of the 3D [15N, 1H]-TROSY-HNCO spectrum and the conventional 3D HNCO spectrum (30) of uniformly 2H/13C/15N-labeled gyrase-23B (1 mM protein concentration in 95% H2O/5% D2O at pH 6.5 and T = 20°C). 26(t1) × 30(t2) × 512(t3) complex points were accumulated, with t1max (15N) = 10.8, t2max(13CO) = 12.0, and t3max(1H) = 48.7 ms. Eight scans per increment were acquired, resulting in a total measuring time of 7 h per 3D spectrum. At the top of each panel, the sequence-specific assignment is indicated by the one-letter amino acid symbol and the residue number in the amino acid sequence, and the ω1(15N) and ω2(13CO) chemical shifts are indicated in parentheses.
Figure 5
Figure 5
Relative signal amplitudes, A, calculated during the ct 15N evolution and 1H acquisition periods for [15N, 1H]-TROSY-HNCA (thick lines) and conventional HNCA (thin lines) at a magnetic field strength of 750 MHz for variable isotropic rotational correlation times, τc, in the range from 5 to 80 ns, which corresponds to protein sizes in H2O solution at 20°C from ≈7 kDa at τc = 5 ns to ≈260 kDa at τc = 80 ns. The solid and dashed lines represent the signal amplitudes, A, for a 15N–1HN moiety in a β-sheet of a deuterated and a protonated 13C/15N-labeled protein, respectively (see Table 1 for the parameters used). (Inset) An expanded plot for the range of A from 0 to 1. The dotted vertical line indicates the τc value of 15 ns estimated for the 23-kDa proteins gyrase-23B and FimC.

References

    1. Wüthrich K, Wider G, Wagner G, Braun W. J Mol Biol. 1982;155:311–319. - PubMed
    1. Wüthrich K. NMR of Proteins and Nucleic Acids. New York: Wiley; 1986.
    1. Montelione G T, Wagner G. J Am Chem Soc. 1989;111:5474–5475.
    1. Ikura M, Kay L E, Bax A. Biochemistry. 1990;29:4659–4667. - PubMed
    1. Bax A, Grzesiek S. Acc Chem Res. 1993;26:131–138.

LinkOut - more resources