

Chemical phenotype matching between a plant and its insect herbivore
- PMID: 9811871
- PMCID: PMC24890
- DOI: 10.1073/pnas.95.23.13743
Chemical phenotype matching between a plant and its insect herbivore
Abstract
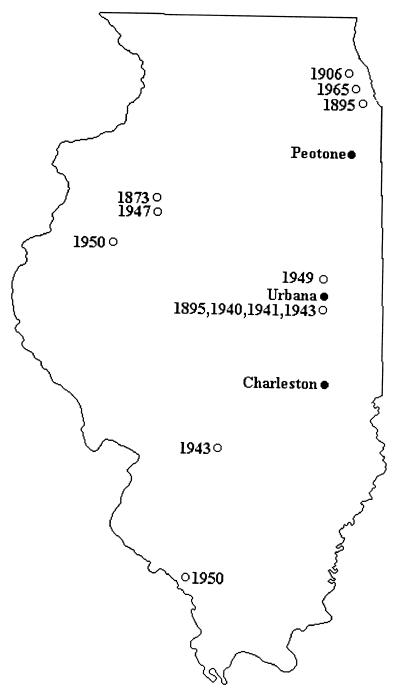
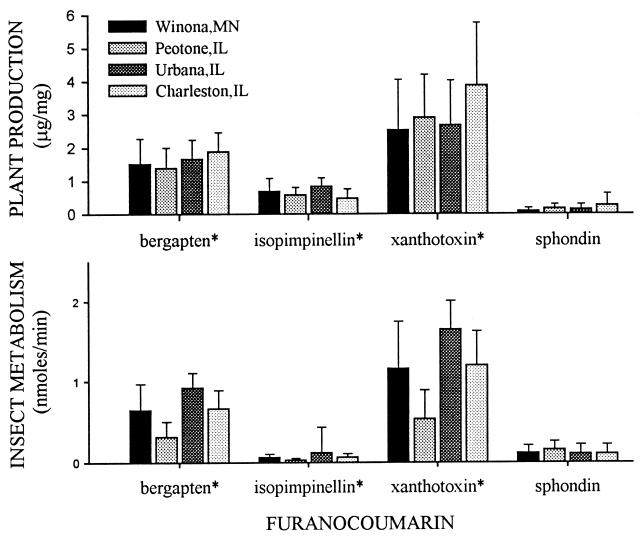
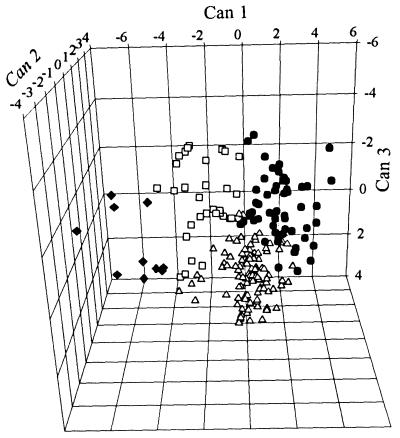
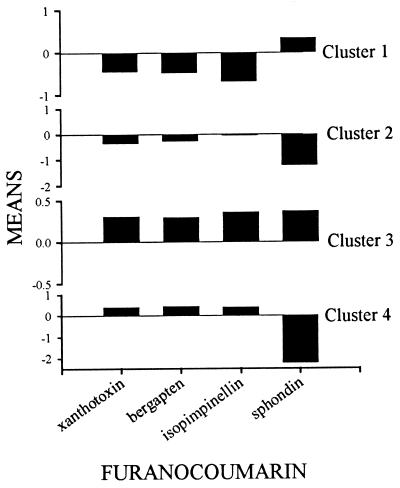
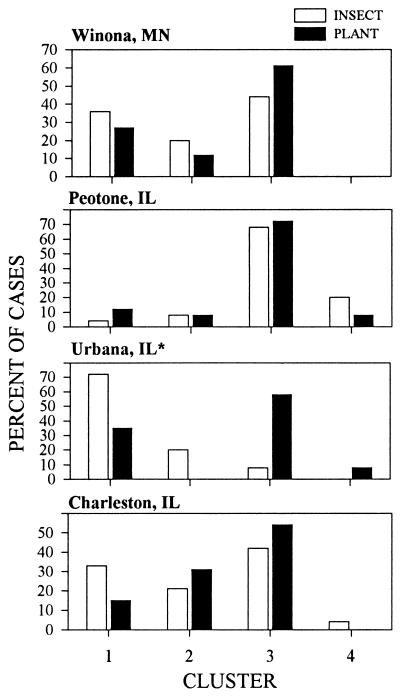
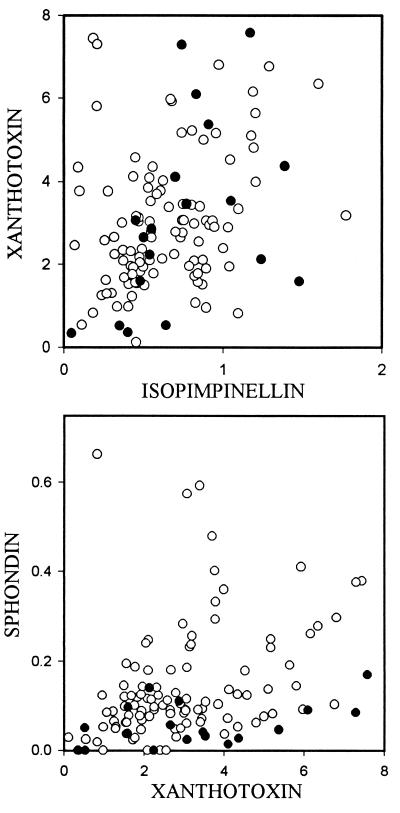
Two potential outcomes of a coevolutionary interaction are an escalating arms race and stable cycling. The general expectation has been that arms races predominate in cases of polygenic inheritance of resistance traits and permanent cycling predominates in cases in which resistance is controlled by major genes. In the interaction between Depressaria pastinacella, the parsnip webworm, and Pastinaca sativa, the wild parsnip, traits for plant resistance to insect herbivory (production of defensive furanocoumarins) as well as traits for herbivore "virulence" (ability to metabolize furanocoumarins) are characterized by continuous heritable variation. Furanocoumarin production in plants and rates of metabolism in insects were compared among four midwestern populations; these traits then were classified into four clusters describing multitrait phenotypes occurring in all or most of the populations. When the frequency of plant phenotypes belonging to each of the clusters is compared with the frequency of the insect phenotypes in each of the clusters across populations, a remarkable degree of frequency matching is revealed in three of the populations. That frequencies of phenotypes vary among populations is consistent with the fact that spatial variation occurs in the temporal cycling of phenotypes; such processes contribute in generating a geographic mosaic in this coevolutionary interaction on the landscape scale. Comparisons of contemporary plant phenotype distributions with phenotypes of herbarium specimens collected 9-125 years ago from across a similar latitudinal gradient, however, suggest that for at least one resistance trait-sphondin concentration-interactions with webworms have led to escalatory change.
Figures
References
-
- Janzen D H. Evolution. 1980;34:611–612. - PubMed
-
- Thompson J N. The Coevolutionary Process. Chicago: Univ. of Chicago Press; 1994. pp. 216–217.
-
- Seger J. Phil Trans R Soc London B. 1988;319:541–555. - PubMed
-
- Berenbaum M R. In: Herbivores: Their Interactions with Secondary Plant Metabolites. Rosenthal G, Berenbaum M, editors. Vol. 1. New York: Academic; 1991. pp. 221–249.
-
- Berenbaum M R, Zangerl A R, Nitao J K. Evolution. 1986;40:1373–1384.
Publication types
MeSH terms
LinkOut - more resources
Full Text Sources
