. 1998 Nov 10;95(23):13812-7.
doi: 10.1073/pnas.95.23.13812.

Characteristics of virus-specific CD8(+) T cells in the liver during the control and resolution phases of influenza pneumonia

Affiliations

Characteristics of virus-specific CD8(+) T cells in the liver during the control and resolution phases of influenza pneumonia

G T Belz et al. Proc Natl Acad Sci U S A. .

Abstract

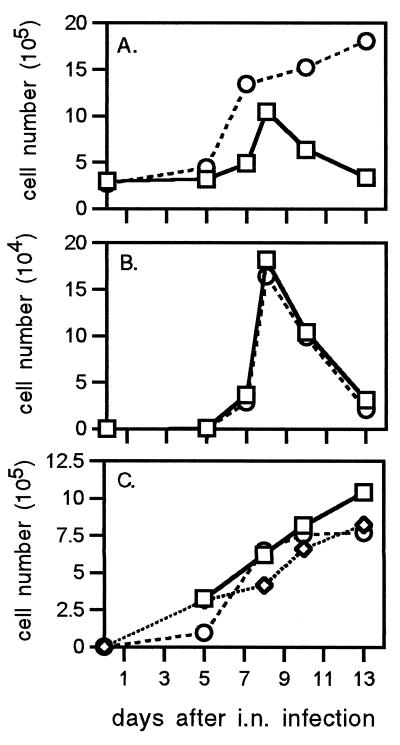
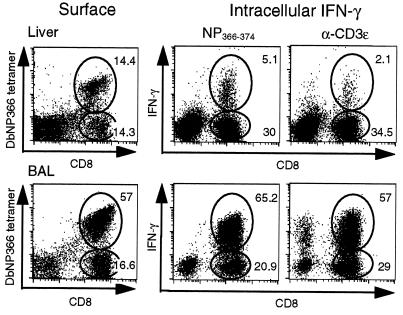
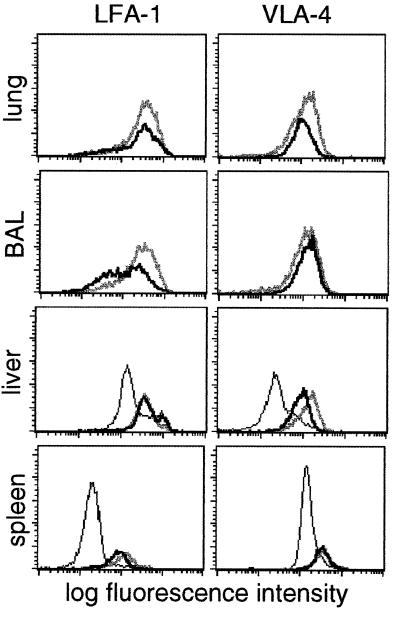
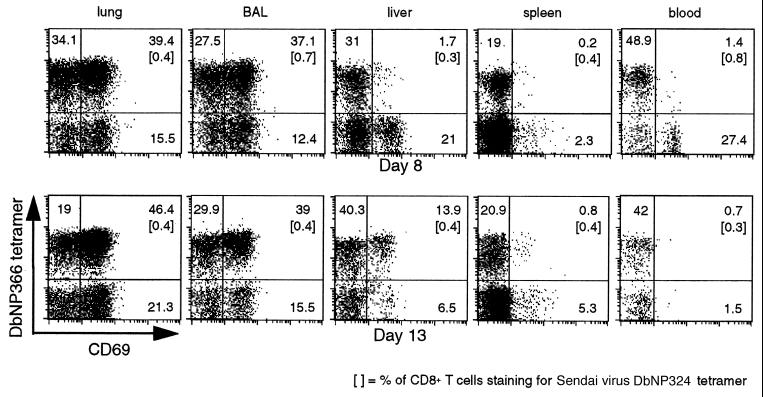
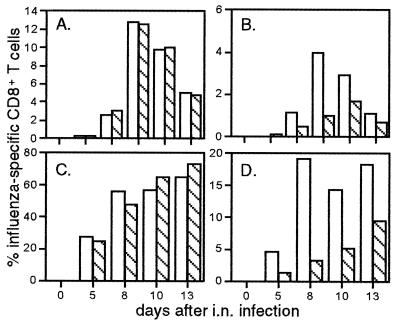
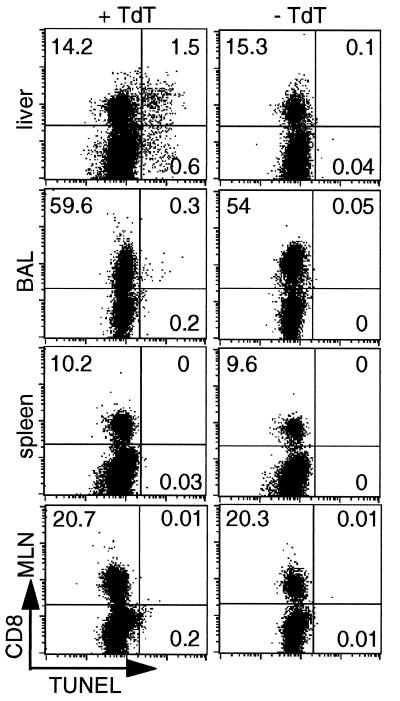
Dissection of the primary and secondary response to an influenza A virus established that the liver contains a substantial population of CD8(+) T cells specific for the immunodominant epitope formed by H-2Db and the influenza virus nucleoprotein peptide fragment NP366-374 (DbNP366). The numbers of CD8(+) DbNP366(+) cells in the liver reflected the magnitude of the inflammatory process in the pneumonic lung, though replication of this influenza virus is limited to the respiratory tract. Analysis of surface phenotypes indicated that the liver CD8(+) DbNP366(+) cells tended to be more "activated" than the set recovered from lymphoid tissue but generally less so than those from the lung. The distinguishing characteristic of the lymphocytes from the liver was that the prevalence of the CD8(+) DbNP366(+) set was always much higher than the percentage of CD8(+) T cells that could be induced to synthesize interferon gamma after short-term, in vitro stimulation with the NP366-374 peptide, whereas these values were generally comparable for virus-specific CD8(+) T cells recovered from other tissue sites. Also, the numbers of apoptotic CD8(+) T cells were higher in the liver. The results overall are consistent with the idea that antigen-specific CD8(+) T cells are destroyed in the liver during the control and resolution phases of this viral infection, though this destruction is not necessarily an immediate process.


Figures

Figure 1
Figure 1
(A) Total CD8+ T cells isolated from the liver during primary and secondary influenza-virus infection. Naïve (□, HKx31, primary) and PR8-immune (○, HKx31 → PR8, secondary) B6 mice were infected with the HKx31 virus, and the lymphocytes were isolated from liver after collagenase IV digestion and separation by 30% metrizamide. (B and C) Mononuclear cells were counted after staining by trypan blue (1%) exclusion with a hemocytometer. Flow-cytometric analysis of CD8+ DbNP366+ T cells recovered from BAL, lung, and liver during primary (HKx31; B) and secondary (HKx31 213 → PR8; C) viral infection. Cells were pooled from six mice for each time point, and the mean numbers of each cell type per mouse were derived from the total cell counts and the proportions stained specifically by flow cytometry. In PR8-immune animals, 800 CD8+ DbNP366+ T cells were isolated from lungs at day 0 of HKx31 infection, 64 days after i.p. priming with 108.5 egg 50% infective dose units of the PR8 virus. No influenza virus-specific CD8+ T cells were detectable in liver at day 0 of the primary or secondary infection. Each point shows the mean of one to four determinations. □, BAL; ◊, lung; ○, liver.
Figure 2
Figure 2
Comparison of influenza virus-specific DbNP366 tetramer staining of CD8+ T cells and the NP peptide-specific response (IFN-γ) of liver (Upper) and BAL (Lower) and lymphocytes isolated 10 days after i.n. infection of PR8-immune mice with HKx31. Lymphocytes were pooled from six mice, then stained with anti-CD8 and DbNP366 tetramer and analyzed by flow cytometry (Left) or cultured for 6 h in complete medium/brefeldin A in the presence or absence of the NP peptide (Center) or anti-CD3ɛ (Right), then stained for surface CD8 and intracellular IFN-γ. For samples incubated without peptide, IFN-γ staining was <0.2%. The numbers give the percentage of gated lymphocytes stained. The total CD8+ and CD8+ DbNP366+ populations recovered from the liver were found to be uniformly CD3ɛ+ in other experiments (data not shown).
Figure 3
Figure 3
Expression of LFA-1 and VLA-4 on CD8+ DbNP366+ T cells during secondary influenza infection. Flow-cytometric analysis of cells within a CD8+ lymphocyte gate isolated from lung, BAL, liver, and spleen is shown for total CD8+ T cells on day 0 (thin line), and for the CD8+ DbNP366+ set on day 8 (thick gray line) and day 13 (thick black line) after i.n. challenge of PR8-immune mice with the HKx31 virus.
Figure 4
Figure 4
The CD8+ DbNP366+ T cells isolated from different anatomical sites express varying levels of the CD69 “early activation” marker. Mononuclear cells were recovered from the lung, BAL, liver, spleen, and blood 8 and 13 days after HKx31 challenge of B6 mice primed i.p. with the PR8 virus 72 days earlier. The numbers given show the percentage of CD8+ T cells in the lymphocyte gate (forward-light scatter vs. side-scatter characteristics) within the respective quadrants. Lymphocytes from BAL and liver were pooled from six mice at each time point.
Figure 5
Figure 5
The percentage of CD8+ T cells staining for DbNP366 (open bars) or for IFN-γ after peptide stimulation (hatched bars) are shown for the primary (A and B) and secondary (C and D) responses in the BAL (A and C) and liver (B and D). Flow-cytometric analysis showing secondary data for a single time point is presented in Fig. 2.
Figure 6
Figure 6
Apoptosis of CD8+ lymphocytes in peripheral tissues. Lymphocytes isolated from liver, BAL, spleen, and mediastinal lymph nodes were analyzed by flow cytometry for CD8 expression and DNA fragmentation (TUNEL assay) 10 days after infection of naïve mice with HKx31 influenza virus. TUNEL staining (+ TdT, Left) and negative control staining (− TdT, Right) are shown for each tissue. The percentages represent the proportion of cells analyzed in a lymphocyte gate found in each quadrant respectively (forward-light scatter vs. side-scatter characteristics).

References

    1. Doherty P C, Topham D J, Tripp R A. Immunol Rev. 1996;150:23–44. - PubMed
    1. Altman J D, Moss P A H, Goulder P J R, Barouch D H, McHeyzer-Williams M G, Bell J I, McMichael A J, Davis M M. Science. 1996;274:94–96. - PubMed
    1. Murali-Krishna K, Altman J D, Suresh M, Sourdive D J, Zajac A J, Miller J D, Slansky J, Ahmed R. Immunity. 1998;8:177–187. - PubMed
    1. Flynn K J, Belz G T, Altman J D, Ahmed R, Woodland D L, Doherty P C. Immunity. 1998;8:683–691. - PubMed
    1. Callan M F, Tan L, Annels N, Ogg G S, Wilson J D, O’Callaghan C A, Steven N, McMichael A J, Rickinson A B. J Exp Med. 1998;187:1395–1402. - PMC - PubMed

Publication types

Substances