. 1998 Nov 2;143(3):613-24.
doi: 10.1083/jcb.143.3.613.

ZAP-70 association with T cell receptor zeta (TCRzeta): fluorescence imaging of dynamic changes upon cellular stimulation

Affiliations

ZAP-70 association with T cell receptor zeta (TCRzeta): fluorescence imaging of dynamic changes upon cellular stimulation

J Sloan-Lancaster et al. J Cell Biol. .

Abstract

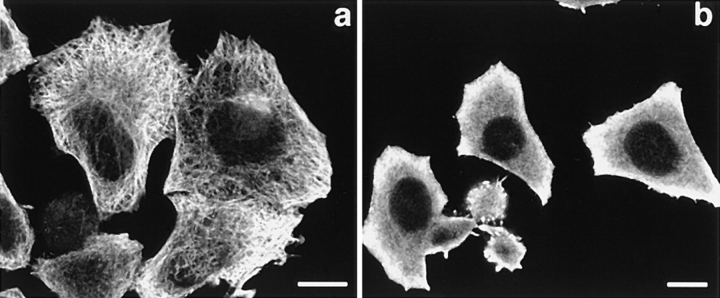
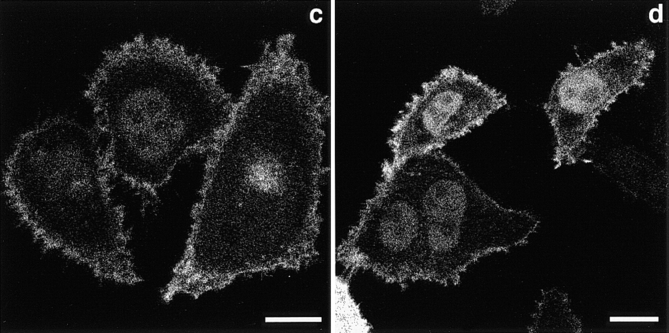
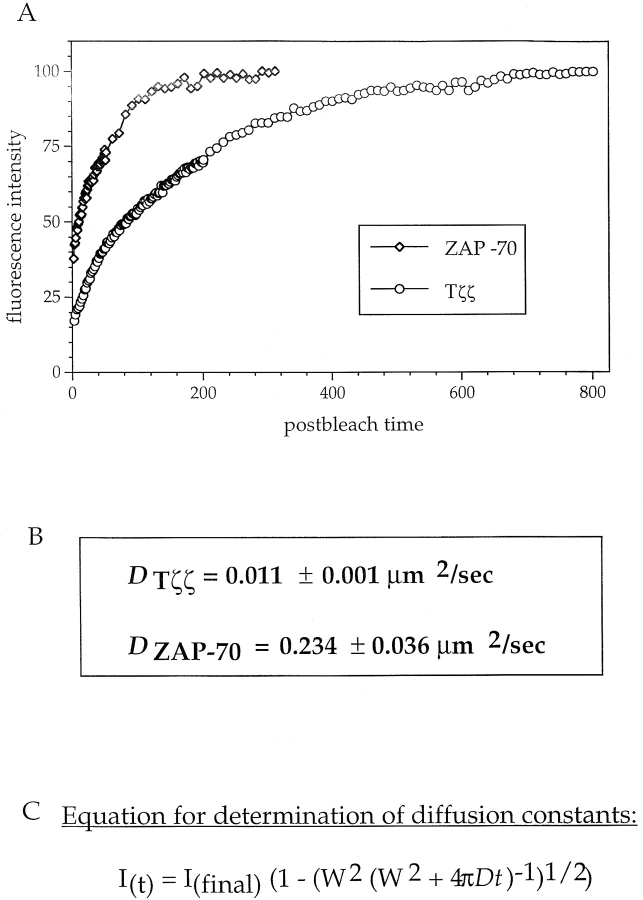
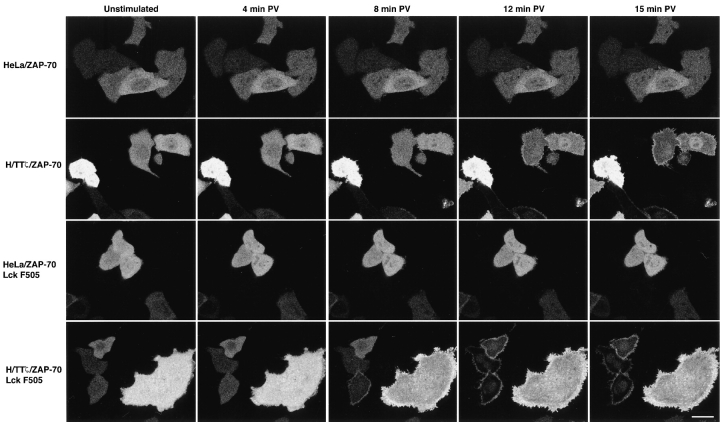
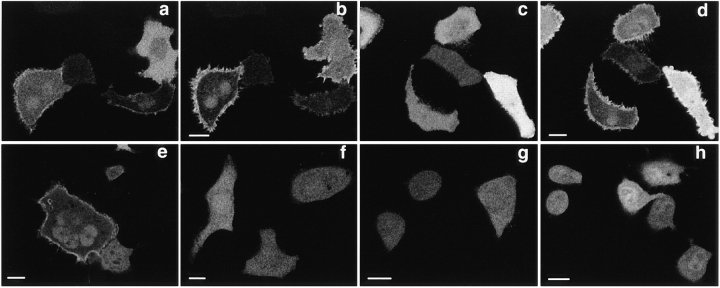
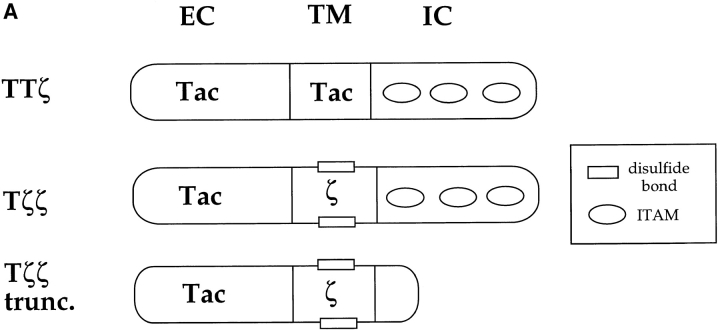
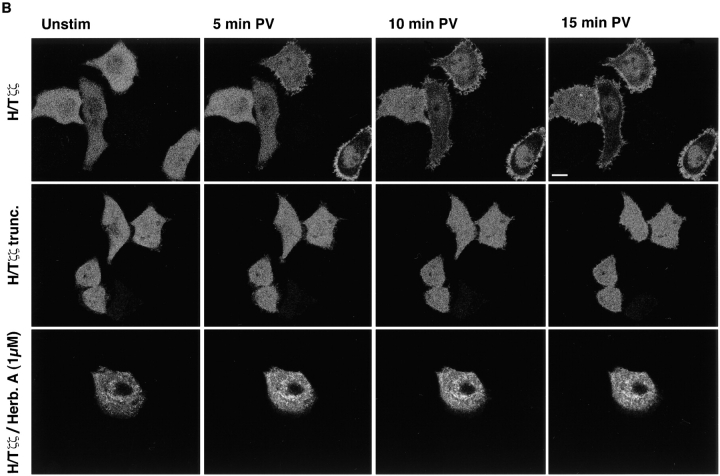
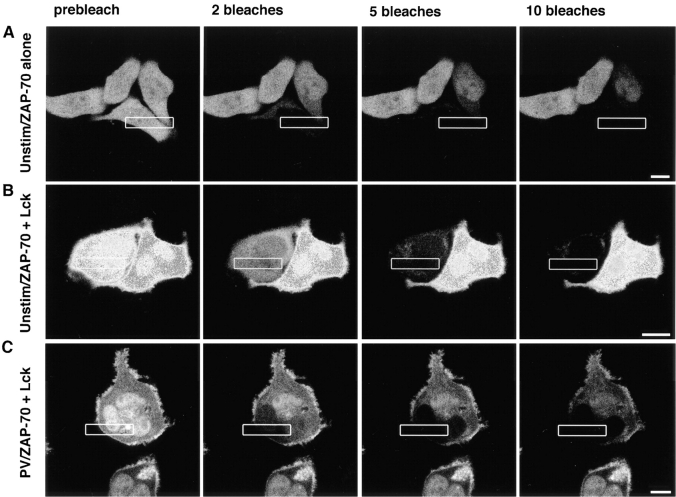
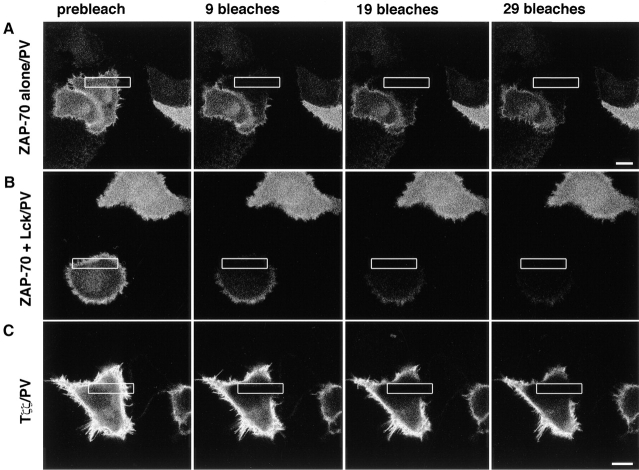
The nonreceptor protein tyrosine kinase ZAP-70 is a critical enzyme required for successful T lymphocyte activation. After antigenic stimulation, ZAP-70 rapidly associates with T cell receptor (TCR) subunits. The kinetics of its translocation to the cell surface, the properties of its specific interaction with the TCRzeta chain expressed as a chimeric protein (TTzeta and Tzetazeta), and its mobility in different intracellular compartments were studied in individual live HeLa cells, using ZAP-70 and Tzetazeta fused to green fluorescent protein (ZAP-70 GFP and Tzetazeta-GFP, respectively). Time-lapse imaging using confocal microscopy indicated that the activation-induced redistribution of ZAP-70 to the plasma membrane, after a delayed onset, is of long duration. The presence of the TCRzeta chain is critical for the redistribution, which is enhanced when an active form of the protein tyrosine kinase Lck is coexpressed. Binding specificity to TTzeta was indicated using mutant ZAP-70 GFPs and a truncated zeta chimera. Photobleaching techniques revealed that ZAP-70 GFP has decreased mobility at the plasma membrane, in contrast to its rapid mobility in the cytosol and nucleus. Tzetazeta- GFP is relatively immobile, while peripherally located ZAP-70 in stimulated cells is less mobile than cytosolic ZAP-70 in unstimulated cells, a phenotype confirmed by determining the respective diffusion constants. Examination of the specific molecular association of signaling proteins using these approaches has provided new insights into the TCRzeta-ZAP-70 interaction and will be a powerful tool for continuing studies of lymphocyte activation.


Figures

Figure 4
Figure 4
Testing microtubule involvement in ZAP-70's redistribution. H/TTζ cells, cotransfected with Lck F505 and ZAP-70 GFP, were left untreated (a and c) or pretreated with nocodazole (33 μM; b and d). In a and b, cells were fixed and immunostained with antitubulin mAb, followed by a rhodamine-coupled anti– mouse secondary mAb. In c and d, cells were stimulated with PV and monitored by time-lapse imaging. Time points 15 min after stimulation are shown. Bars, 15 μm.
Figure 4
Figure 4
Testing microtubule involvement in ZAP-70's redistribution. H/TTζ cells, cotransfected with Lck F505 and ZAP-70 GFP, were left untreated (a and c) or pretreated with nocodazole (33 μM; b and d). In a and b, cells were fixed and immunostained with antitubulin mAb, followed by a rhodamine-coupled anti– mouse secondary mAb. In c and d, cells were stimulated with PV and monitored by time-lapse imaging. Time points 15 min after stimulation are shown. Bars, 15 μm.
Figure 7
Figure 7
Quantitative FRAP experiments to determine diffusion constants for ZAP-70 GFP and Tζζ–GFP. (A) Fluorescence intensities in recovery after photobleaching, normalized to maximal levels (100%) for both ZAP-70 GFP and Tζζ–GFP, are plotted versus time. Data points were taken at 2-s intervals for 200 s (Tζζ–GFP) or at 1-s intervals for 50 s (ZAP-70 GFP) and then at 10-s intervals until they had reached a steady plateau. (B) Diffusion constants ± SD, expressed as a mean from five (Tζζ–GFP) or six (ZAP-70 GFP) independent experiments, are given. Simulated values were 0.016 and 0.09 μm2/s for Tζζ–GFP and ZAP-70 GFP, respectively. (C) Equation used to derive diffusion constants assuming one-dimensional recovery.
Figure 1
Figure 1
Activation-induced movement of ZAP-70 to the cell surface in TCRζ-expressing HeLa cells and its enhancement by Lck F505. Individual live HeLa or H/TTζ cells were monitored by time-lapse imaging confocal microscopy. Lck F505 was cotransfected with ZAP-70 GFP in the bottom two rows. Two images were taken before PV addition, with subsequent images collected every 30 s thereafter. One prestimulation image is shown for each experimental group, followed by those at 4, 8, 12, and 15 min after stimulation. Bar: (Rows 1, 3, and 4) 21 μm; (row 2) 27 μm.
Figure 2
Figure 2
Analysis of the redistribution of ZAP-70 GFP mutants. H/TTζ cells expressing Lck F505 were cotransfected with the following ZAP-70 GFP constructs: wild-type (a and b), kinase-dead (c and d), tandem SH2 domains (e), kinase domain alone (f), SH2(N) + kinase (g), or SH2(C) + kinase (h). Protein movement in response to PV stimulation was followed by time-lapse imaging. Images are shown for unstimulated conditions (a and c) and 15 min after stimulation (b and d–h). Bars, 14 μm.
Figure 3
Figure 3
Requirements of TCRζ for ZAP-70 redistribution. (A) Schematic of the molecular domains of the various chimeric ζ molecules used. (B) H/Tζζ (top and bottom rows) or H/Tζζ trunc (middle row) cells, expressing Lck F505 and ZAP-70 GFP, were monitored by time-lapse imaging. Images were taken at 30-s intervals, and those at 5-min increments are shown. Bar, 13.3 μm.
Figure 3
Figure 3
Requirements of TCRζ for ZAP-70 redistribution. (A) Schematic of the molecular domains of the various chimeric ζ molecules used. (B) H/Tζζ (top and bottom rows) or H/Tζζ trunc (middle row) cells, expressing Lck F505 and ZAP-70 GFP, were monitored by time-lapse imaging. Images were taken at 30-s intervals, and those at 5-min increments are shown. Bar, 13.3 μm.
Figure 5
Figure 5
ZAP-70 becomes less mobile when it moves to the cell surface. H/TTζ cells expressing ZAP-70 GFP alone (A) or together with Lck F505 (B and C) were left unstimulated (A and B) or were stimulated with PV for 12 min before commencement of FLIP (C). FLIP was then carried out as described in Materials and Methods, with the boxed rectangle indicating the area being repetitively bleached. Images collected before bleaching and after 2, 5, and 10 bleaches are shown. Bars, 15 μm.
Figure 6
Figure 6
Membrane-associated ZAP-70 is more mobile than TCRζ. H/TTζ cells expressing ZAP-70 GFP alone (A) or together with Lck F505 (B), or HeLa cells expressing Tζζ–GFP (C), were stimulated for 12 min before commencement of FLIP. The area repetitively photobleached is indicated by the rectangle. Images collected before bleaching and after 9, 19, and 29 photobleaches are shown. Bars, 12 μm.

References

    1. Arpaia E, Shahar M, Dadi H, Cohen A, Roifman CM. Defective T cell receptor signaling and CD8+thymocyte selection in humans lacking ZAP-70 kinase. Cell. 1994;76:947–958. - PubMed
    1. Babbitt BP, Allen PM, Matsueda G, Haber E, Unanue ER. Binding of immunogenic peptides to Ia histocompatibility molecules. Nature. 1985;317:359–361. - PubMed
    1. Bentley GA, Mariuzza RA. The structure of the T cell antigen receptor. Annu Rev Immunol. 1996;14:563–590. - PubMed
    1. Bu J-Y, Shaw AS, Chan AC. Analysis of the interaction of ZAP-70 and syk protein-tyrosine kinases with the T-cell antigen receptor by plasmon resonance. Proc Natl Acad Sci USA. 1995;92:5106–5110. - PMC - PubMed
    1. Cantrell D. T cell antigen receptor signal transduction pathways. Annu Rev Immunol. 1996;14:259–274. - PubMed

MeSH terms