. 1998 Nov 2;143(3):767-75.
doi: 10.1083/jcb.143.3.767.

Cell cycle-related changes in the conducting properties of r-eag K+ channels

Affiliations

Cell cycle-related changes in the conducting properties of r-eag K+ channels

L A Pardo et al. J Cell Biol. .

Abstract

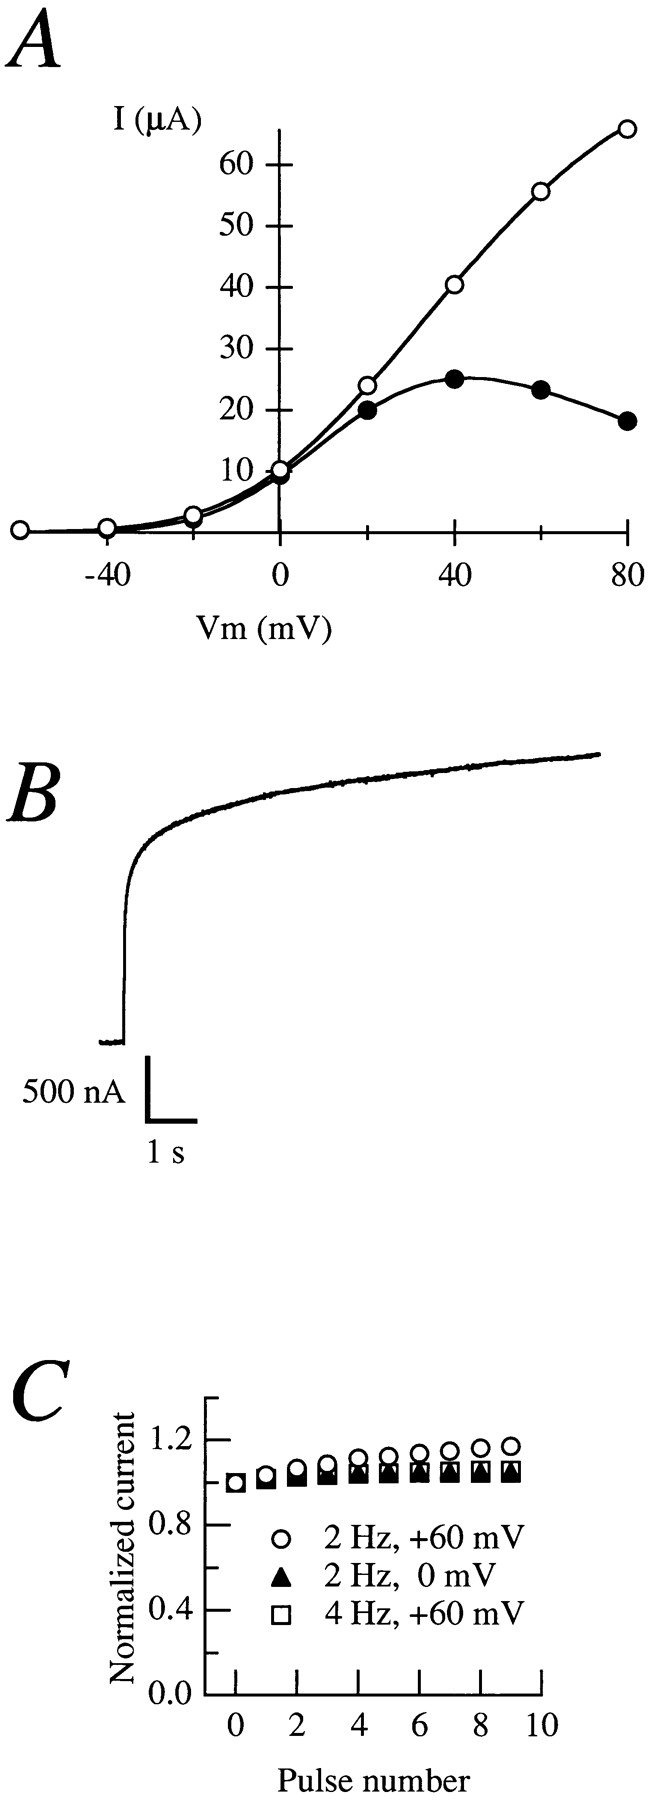
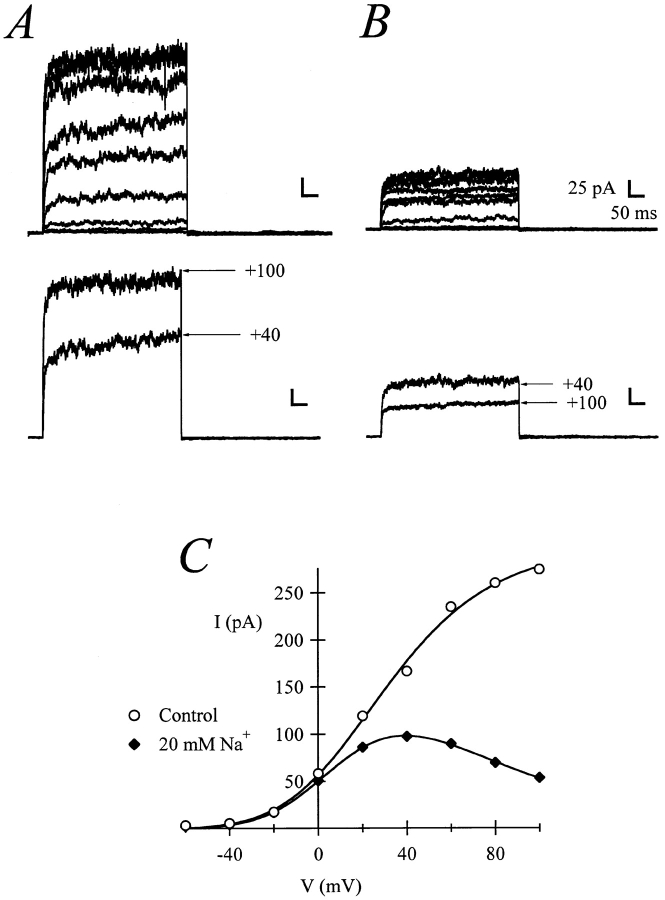
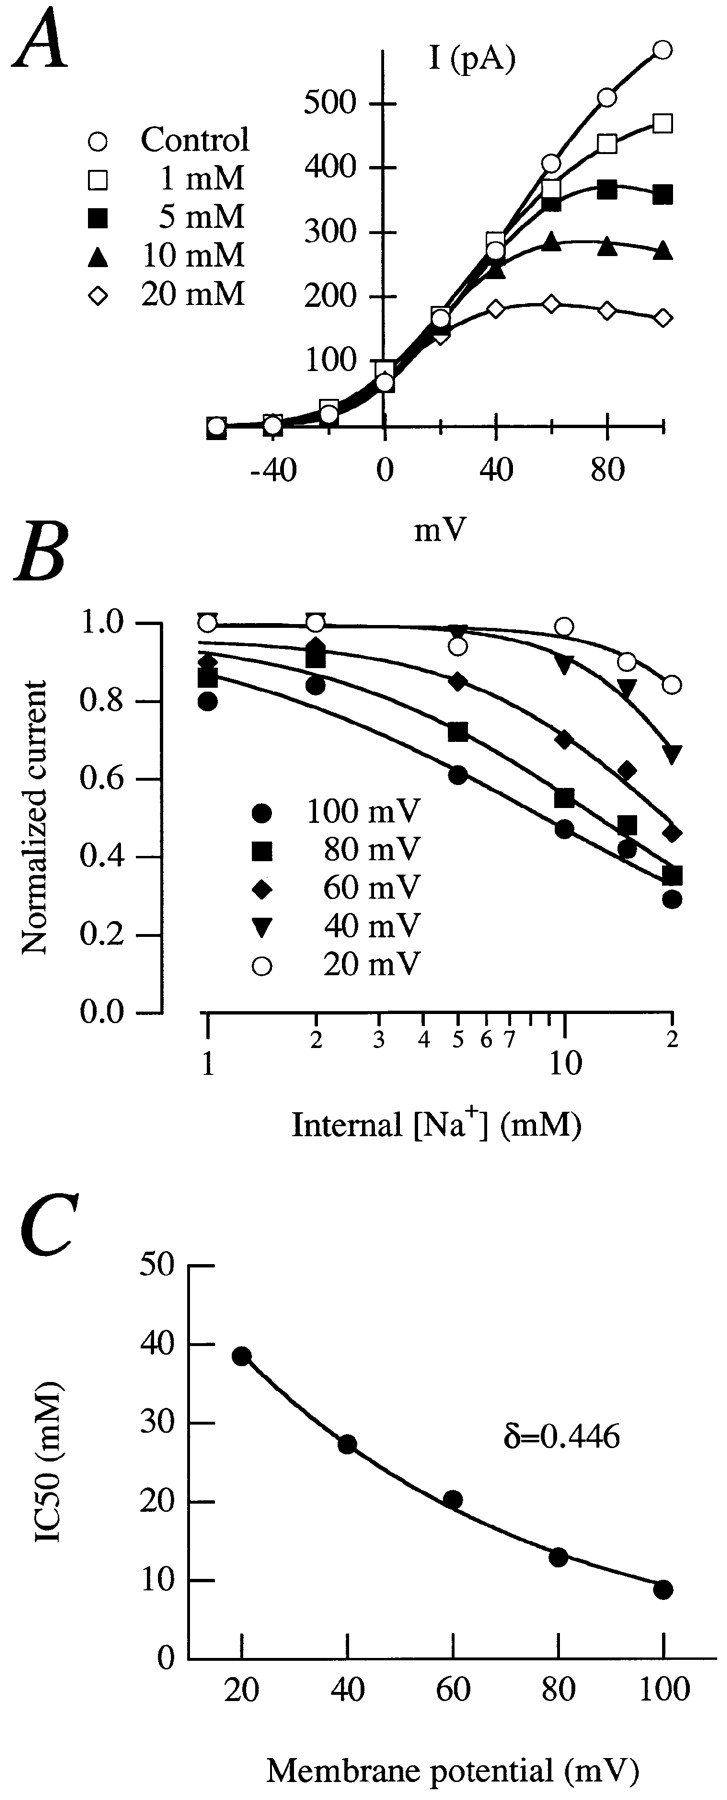
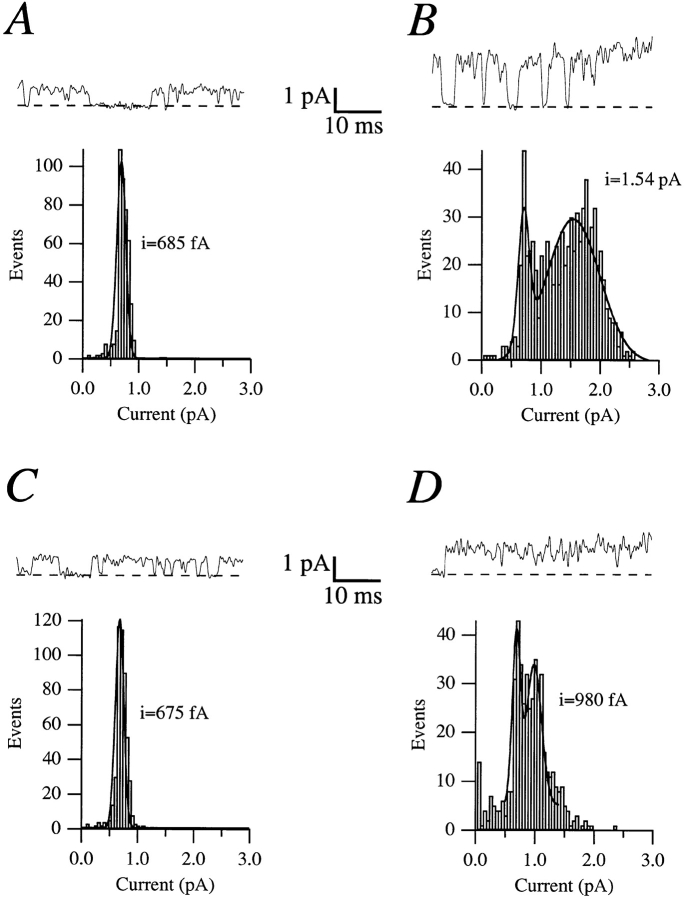
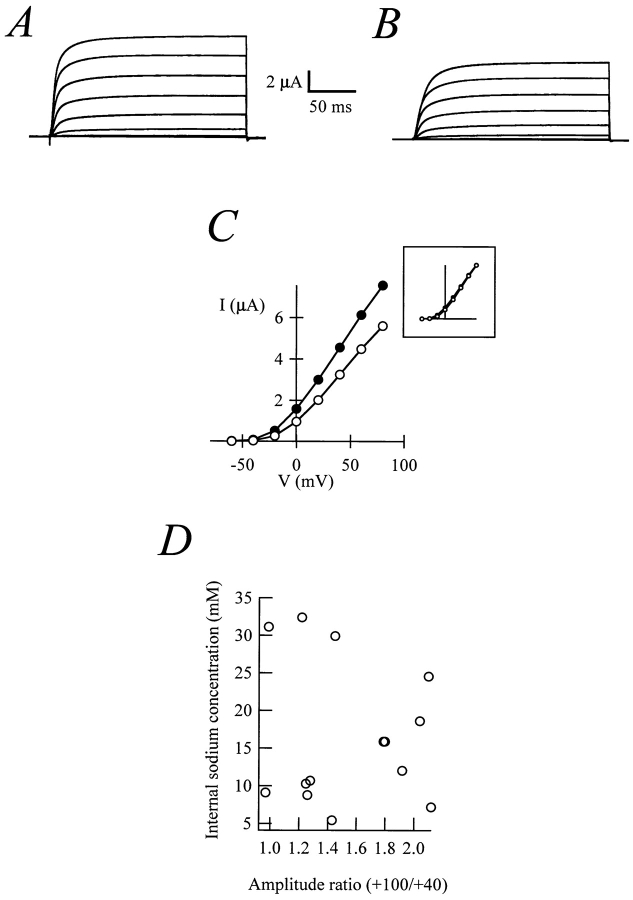
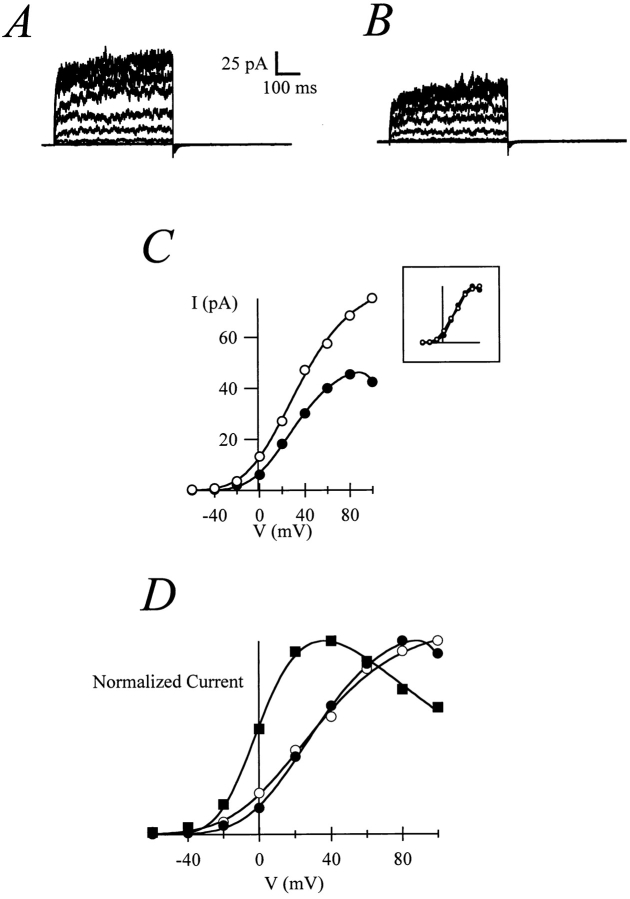
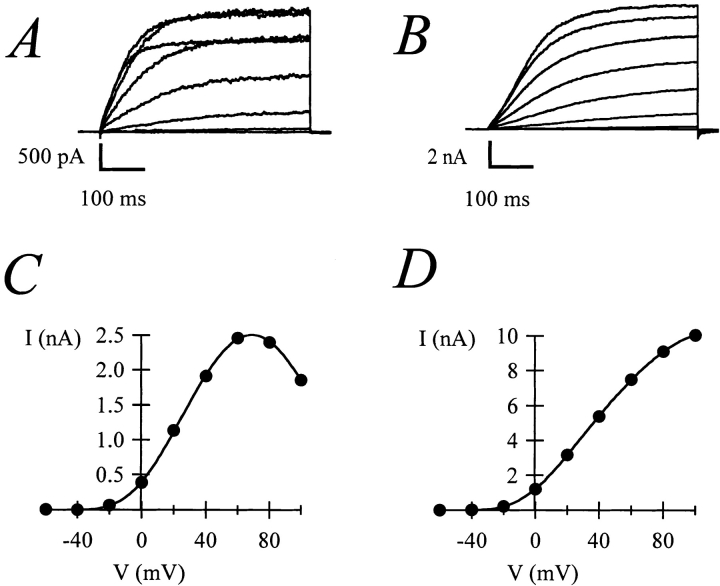
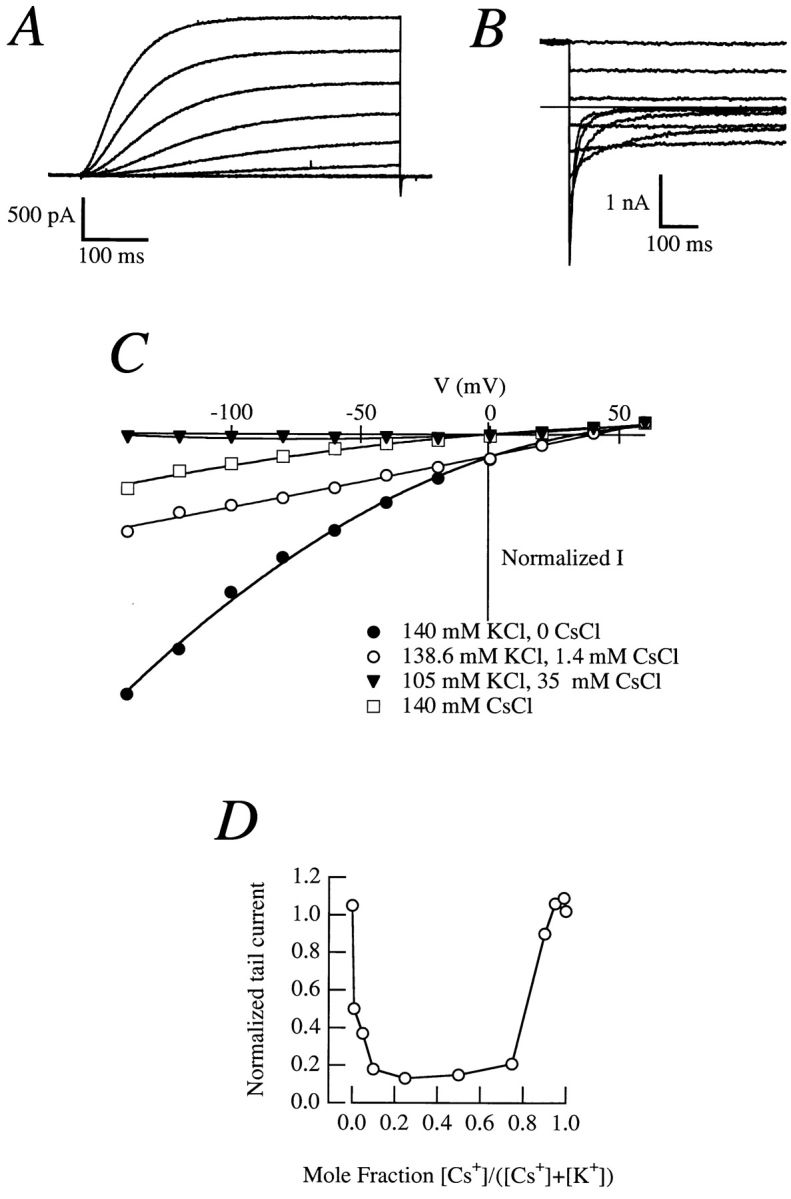
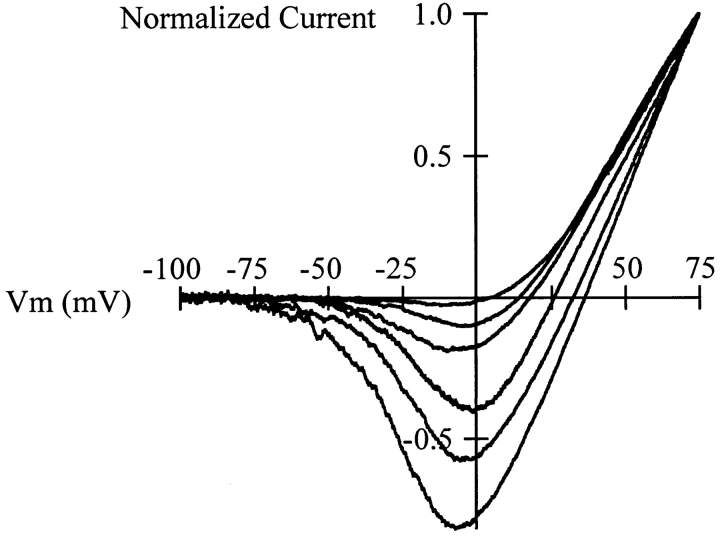
Release from arrest in G2 phase of the cell cycle causes profound changes in rat ether-à-go-go (r-eag) K+ channels heterologously expressed in Xenopus oocytes. The most evident consequence of the onset of maturation is the appearance of rectification in the r-eag current. The trigger for these changes is located downstream of the activation of mitosis-promoting factor (MPF). We demonstrate here that the rectification is due to a voltage-dependent block by intracellular Na+ ions. Manipulation of the intracellular Na+ concentration indicates that the site of Na+ block is located approximately 45% into the electrical distance of the pore and is only present in oocytes undergoing maturation. Since the currents through excised patches from immature oocytes exhibited a fast rundown, we studied CHO-K1 cells permanently transfected with r-eag. These cells displayed currents with a variable degree of block by Na+ and variable permeability to Cs+. Partial synchronization of the cultures in G0/G1 or M phases of the cell cycle greatly reduced the variability. The combined data obtained from mammalian cells and oocytes strongly suggest that the permeability properties of r-eag K+ channels are modulated during cell cycle-related processes.


Figures

Figure 1
Figure 1
(A) Current–voltage relationships obtained from the same oocyte before (open circles) and after (filled circles) treatment with 20 μg/ ml progesterone in NFR. The current amplitudes were determined by depolarizing pulses from a holding potential of −100 mV to voltages ranging between −60 and +80 mV in 20-mV steps. The amplitude was measured as mean steady-state current at the final 10% of a 500-ms pulse. (B) Current elicited by a 20-s depolarization to +80 mV from an oocyte expressing rectifying currents. (C) Normalized current obtained during different frequency and/or voltage stimulations (open circles, 2 Hz, +60 mV; filled triangles, 2 Hz, 0 mV; open squares, 4 Hz, +60 mV).
Figure 2
Figure 2
Raw current traces from the same patch in the absence (A) or in the presence of 20 mM NaCl in the internal solution (B). C shows the current–voltage relationships under both conditions. The voltage protocol consisted of a 200-ms depolarization from a holding potential of −80 mV. The amplitude was determined as mean current at the end of the test pulse. The scale bars correspond to 25 pA and 50 ms.
Figure 3
Figure 3
(A) Normalized current–voltage relationships in an inside-out patch from an oocyte expressing rectifying currents in the presence of different internal Na+ concentrations. The stimulation protocol was as the one in Fig. 2. (B) Dose–response plots for effects of Na+. The solid lines are fits to the Hill equation. (C) IC50 plotted versus voltage. The exponential fit to Eq. 1 gave a value for δ of 0.446.
Figure 4
Figure 4
Sample traces and amplitude histograms obtained from the same patch without (A and B) or with (C and D) 5 mM NaCl added to the intracellular side, at either 0 (A and C) or +80 mV (B and D). The single channel currents are obtained from the fit to a Gaussian distribution. The smaller amplitude in the histograms at +80 mV corresponds to the amplitude of the flickering of the channel, and remains constant in the absence (B) or in the presence (D) of Na+.
Figure 5
Figure 5
Currents recorded from a whole oocyte before (A) and after (B) the injection of 50 nl 2 M NaCl. (C) Current–voltage plots for steady-state currents from A and B. (Inset) The normalized currents. (D) Lack of correlation between the internal Na+ concentration (calculated from the reversal potential of Na+ currents) and the degree of rectification of r-eag currents. The correlation coefficient is −0.1.
Figure 6
Figure 6
Before maturation, patches expressing r-eag currents show only slight rectification with 20 mM Na+ (A, control traces; B, 20 mM Na+), as can be seen in the I-V plot (C; open circles, control; solid circles, 20 mM NaCl) and more clearly after normalization of the current amplitude (inset). After MPF injection, patches from the same oocyte show rectification comparable to mature oocytes (D; solid squares); for comparison, the normalized current amplitudes from A and B have been included (symbols as in C).
Figure 7
Figure 7
Variability in the degree of blockade by internal Na+ in CHO-K1 cells. (A and B) Raw currents traces obtained from two apparently identical cells (500-ms depolarizations to voltages between −60 and +100 mV, in 20-mV increments). (C and D) Corresponding I-V relationships. The internal solution contained 140 mM KCl and 10 mM NaCl.
Figure 8
Figure 8
(A) Outward currents in a CHO-K1 cell expressing r-eag exposed to an internal solution containing Cs+ as the sole charge carrier; the same internal solution was used in B–D. (B) Tail currents in a cell exposed to an external solution containing (mM) 140 CsCl, 2 CaCl2, 2 MgCl2, 10 Hepes/CsOH, pH 7.2. The reversal potential is ∼0 mV. (C) Instantaneous I-V plots in cells with Cs+ internal solution and varying extracellular K+ and Cs+ concentrations. (D) Anomalous mole fraction effect obtained from tail currents in a cell perfused with different K+-Cs+ mixtures. The tail current at −100 mV (extrapolation to t = 0 of the exponential decay of the amplitude) was normalized to the outward current at +60 mV (mean amplitude at the final 10% of the pulse).
Figure 9
Figure 9
Normalized currents obtained during voltage ramps in CHO-K1 cells expressing r-eag currents. The internal solution contained Cs+ as charge carrier, and the external solution contained K+. From a holding potential of −100 mV, the cell was progressively depolarized to +75 mV during 1 s. Notice the strong variability in the reversal potential, while the shape of the current is similar in all cases.

References

    1. Baukrowitz T, Yellen G. Modulation of K+ current by frequency and external [K+]: a tale of two inactivation mechanisms. Neuron. 1995;15:951–960. - PubMed
    1. Bezanilla F, Armstrong CM. Negative conductance caused by entry of Na+ and Cs+ ions into the K+channels of squid axons. J Gen Physiol. 1972;60:588–608. - PMC - PubMed
    1. Borin M, Siffert W. Stimulation by thrombin increases the cytosolic free Na+ concentration in human platelets. Studies with the novel fluorescent cytosolic Na+ indicator Na+-binding benzofuran isophthalate. J Biol Chem. 1990;265:19543–19550. - PubMed
    1. Brüggemann A, Pardo LA, Stühmer W, Pongs O. Ether-à-go-go encodes a voltage-gated channel permeable to K+ and Ca 2+and modulated by cAMP. Nature. 1993;365:445–448. - PubMed
    1. Brüggemann A, Stühmer W, Pardo LA. Mitosis-promoting factor-mediated suppression of a cloned delayed rectifier K+ channel expressed in Xenopusoocytes. Proc Natl Acad Sci USA. 1997;94:537–542. - PMC - PubMed