. 1998 Nov 16;188(10):1817-30.
doi: 10.1084/jem.188.10.1817.

The JNK pathway regulates the In vivo deletion of immature CD4(+)CD8(+) thymocytes

Affiliations

The JNK pathway regulates the In vivo deletion of immature CD4(+)CD8(+) thymocytes

M Rincón et al. J Exp Med. .

Abstract

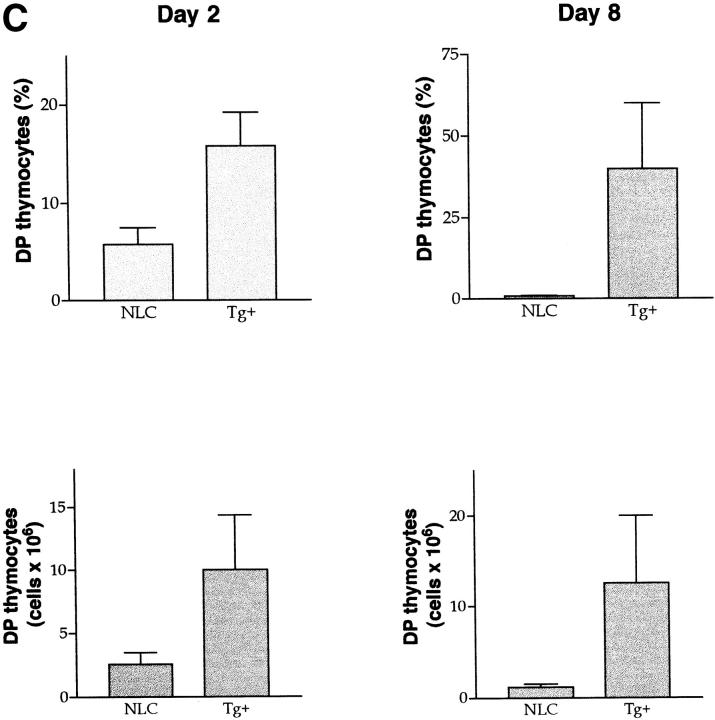
The extracellular signal-regulated kinase (ERK), the c-Jun NH2-terminal kinase (JNK), and p38 MAP kinase pathways are triggered upon ligation of the antigen-specific T cell receptor (TCR). During the development of T cells in the thymus, the ERK pathway is required for differentiation of CD4(-)CD8(-) into CD4(+)CD8(+) double positive (DP) thymocytes, positive selection of DP cells, and their maturation into CD4(+) cells. However, the ERK pathway is not required for negative selection. Here, we show that JNK is activated in DP thymocytes in vivo in response to signals that initiate negative selection. The activation of JNK in these cells appears to be mediated by the MAP kinase kinase MKK7 since high levels of MKK7 and low levels of Sek-1/MKK4 gene expression were detected in thymocytes. Using dominant negative JNK transgenic mice, we show that inhibition of the JNK pathway reduces the in vivo deletion of DP thymocytes. In addition, the increased resistance of DP thymocytes to cell death in these mice produces an accelerated reconstitution of normal thymic populations upon in vivo DP elimination. Together, these data indicate that the JNK pathway contributes to the deletion of DP thymocytes by apoptosis in response to TCR-derived and other thymic environment- mediated signals.


Figures

Figure 1
Figure 1
Regulation of JNK activation in DP thymocytes. (A) JNK activity in stimulated DP thymocytes in vitro. DP thymocytes were obtained by staining of total thymocytes with an anti-CD4 and anti-CD8 mAb and cell sorting (FACS®). Purified DP thymocytes (5 × 10⁵ cells) were incubated in the presence of medium (−), immobilized anti-CD3 mAb (10 μg/ml) (anti-CD3), or immobilized anti-CD3 (10 μg/ml) plus anti-CD28 (10 μg/ml) mAbs (anti-CD3/CD28) for 3 h. JNK1 was immunopurified from DP extracts and assayed for kinase activity in vitro using the GST-cJun as substrate. The radioactivity incorporated into GST–c-Jun was quantitated after SDS-PAGE by PhosphorImager analysis. (B) Activation of JNK1 upon in vivo anti-CD3 mAb injection. Wild-type mice were injected with PBS (−) or anti-CD3 mAb (2C11, 50 μg/200 μl PBS) for 6 or 12 h. Total thymocytes were stained for CD4 and CD8, and DP thymocytes (4 × 10⁵ cells) were isolated by cell sorting. JNK1 was immunopurified from DP extracts and assayed for kinase activity, as described in A. (C) Activation of JNK1 upon Con A stimulation in vitro. DP thymocytes (5 × 10⁵ cells) were obtained as described in A and treated with medium alone (−) or Con A (2.5 μg/ml) for 2 or 4 h. JNK1 activity was determined as described in A.
Figure 1
Figure 1
Regulation of JNK activation in DP thymocytes. (A) JNK activity in stimulated DP thymocytes in vitro. DP thymocytes were obtained by staining of total thymocytes with an anti-CD4 and anti-CD8 mAb and cell sorting (FACS®). Purified DP thymocytes (5 × 10⁵ cells) were incubated in the presence of medium (−), immobilized anti-CD3 mAb (10 μg/ml) (anti-CD3), or immobilized anti-CD3 (10 μg/ml) plus anti-CD28 (10 μg/ml) mAbs (anti-CD3/CD28) for 3 h. JNK1 was immunopurified from DP extracts and assayed for kinase activity in vitro using the GST-cJun as substrate. The radioactivity incorporated into GST–c-Jun was quantitated after SDS-PAGE by PhosphorImager analysis. (B) Activation of JNK1 upon in vivo anti-CD3 mAb injection. Wild-type mice were injected with PBS (−) or anti-CD3 mAb (2C11, 50 μg/200 μl PBS) for 6 or 12 h. Total thymocytes were stained for CD4 and CD8, and DP thymocytes (4 × 10⁵ cells) were isolated by cell sorting. JNK1 was immunopurified from DP extracts and assayed for kinase activity, as described in A. (C) Activation of JNK1 upon Con A stimulation in vitro. DP thymocytes (5 × 10⁵ cells) were obtained as described in A and treated with medium alone (−) or Con A (2.5 μg/ml) for 2 or 4 h. JNK1 activity was determined as described in A.
Figure 2
Figure 2
TCR-mediated deletion of DP thymocytes in vivo and in vitro. (A) Total thymocytes from untreated mice were incubated for 24 h in the presence of medium alone (Control) or immobilized anti-CD3 (10 μg/ml) plus anti-CD28 (10 μg/ml) mAbs (In vitro anti-CD3/anti-CD28); total thymocytes were isolated from mice injected with anti-CD3 mAb (2C11, 50 μg/200 μl PBS) for 2 d (In vivo anti-CD3). The cells were stained with anti-CD4 and anti-CD8 mAbs and analyzed by flow cytometry. Profiles for CD4 and CD8 expression in gated live cells are presented. Numbers represent the percentage of each population (DP, CD4+, and CD8+). (B) Total thymocytes were incubated for 24 h in the presence of medium alone (Control) or Con A (2.5 μg/ml) (ConA). The cells were then examined as described in A.
Figure 3
Figure 3
MKK4 and MKK7 expression in thymocytes. (A) MKK4 and MKK7 gene expression. Total RNA was isolated from the thymus or brain from wild-type mice and analyzed by Northern blot as described in Materials and Methods, using specific 32P-labeled cDNA probes for MKK7, MKK4, and HPRT genes. (B) MKK4 and JNK protein expression. Whole extracts were obtained from the thymus and brain from wild-type mice and analyzed by Western blot as described in Materials and Methods using an anti-MKK4 specific mAb or anti-JNK polyclonal antibody.
Figure 4
Figure 4
Generation and characterization of lck-dnJNK1 transgenic mice. (A) Schematic representation of the dnJNK1 transgene. The dnJNK1 cDNA in which Thr183 and Tyr185 were replaced by Ala and Phe, respectively, was subcloned downstream of the distal lck promoter and upstream of the hGH polyadenylation signals and intron sequences. (B) Expression of the dnJNK1 transgene. The presence of the dnJNK1 mRNA was analyzed in total thymocytes from positive mice from three independent transgenic lines (Tg+; lines 37, 44 and 45) or from negative littermate control mice (NLC) by reverse transcriptase-PCR using specific primers for the dnJNK1 transgene. As positive control, γ-actin primers were used. (C) Comparative expression of the endogenous JNK1 gene and the dnJNK1 transgene. cDNA from spleen or purified T cells from a dnJNK1 transgenic mouse (line 44) was analyzed by PCR using specific primers for endogenous mouse JNK1, the dnJNK1 transgene, or HPRT. (D) Semiquantitative PCR analysis for the expression of the endogenous JNK1 gene and dnJNK1 transgene using different amounts of cDNA (0.5, 2.5, and 5 μl in the left, center, and right lanes, respectively) prepared from the thymus of a dnJNK1 mouse. (E) JNK1 activity is reduced in dnJNK1 mice. Total thymocytes (5 × 10⁵) from dnJNK1 (Tg+) or negative littermate control mice were unstimulated or stimulated with PMA (5 ng/ml) plus ionomycin (250 ng/ml) (P/I) for 30 min, harvested, and lysed. Whole extracts were assayed for JNK activity using the substrate GST–c-Jun (26). (F) AP-1 transcriptional activity is inhibited in dnJNK1 transgenic mice. T cells (5 × 10⁵ cells) were purified from AP-1–luciferase reporter transgenic mice (NLC) or double AP1-luciferase × dnJNK1 transgenic mice (Tg+) and were incubated with medium alone (−) or with PMA (5 ng/ml) plus ionomycin (250 ng/ml) (P/I). After 24 h, the cells were harvested and luciferase activity was measured. The data shown are representative of two independent experiments.
Figure 5
Figure 5
Proliferative T cell response in dnJNK1 mice. (A) Cell surface staining for CD4 and CD8 in total lymph node cells from dnJNK1 transgenic (line 44) (Tg+) or negative littermate control (NLC) mice was analyzed by flow cytometry. The numbers represent the percentage of cells in each quadrant. (B) Spleen cells (2 × 10⁵ cells/well) from dnJNK1 (Tg+) or negative littermates control (NLC) mice were stimulated with Con A (2.5 μg/ml), anti-CD3 mAb (1 μg/ml), or PMA (5 ng/ml) plus ionomycin (250 ng/ml) (P/I) and proliferation was determined by [3H]thymidine incorporation. Results are representative of three independent experiments. (C) Purified CD4+ T cells (5 × 10⁴ cells/well) from dnJNK1 (Tg+) and negative littermate control (NLC) mice were stimulated with Con A (2.5 μg/ml) in the presence of the indicated numbers of mitomycin C (50 μg/ml) treated splenocytes from wild-type mice as the source of APC. Numbers (%) represent the percentage of proliferation of dnJNK1 CD4+ T cells compared with the proliferation of CD4+ T cells from NLC mice.
Figure 5
Figure 5
Proliferative T cell response in dnJNK1 mice. (A) Cell surface staining for CD4 and CD8 in total lymph node cells from dnJNK1 transgenic (line 44) (Tg+) or negative littermate control (NLC) mice was analyzed by flow cytometry. The numbers represent the percentage of cells in each quadrant. (B) Spleen cells (2 × 10⁵ cells/well) from dnJNK1 (Tg+) or negative littermates control (NLC) mice were stimulated with Con A (2.5 μg/ml), anti-CD3 mAb (1 μg/ml), or PMA (5 ng/ml) plus ionomycin (250 ng/ml) (P/I) and proliferation was determined by [3H]thymidine incorporation. Results are representative of three independent experiments. (C) Purified CD4+ T cells (5 × 10⁴ cells/well) from dnJNK1 (Tg+) and negative littermate control (NLC) mice were stimulated with Con A (2.5 μg/ml) in the presence of the indicated numbers of mitomycin C (50 μg/ml) treated splenocytes from wild-type mice as the source of APC. Numbers (%) represent the percentage of proliferation of dnJNK1 CD4+ T cells compared with the proliferation of CD4+ T cells from NLC mice.
Figure 6
Figure 6
Normal positive selection in dnJNK1 transgenic mice. (A) Cell surface staining for CD4 and CD8 in total thymocytes from dnJNK1 transgenic (line 44) (Tg+) or negative littermate control (NLC) mice was analyzed by flow cytometry. The numbers represent the percentage of cells in each quadrant. (B) Total thymocytes from Cyt c TCR transgenic mice (NLC) or Cyt c TCR × dnJNK1 double transgenic mice (Tg+) were analyzed for CD4 and CD8 expression in the total thymus (top) and Vβ3 expression in the DP or single CD4+ gates (bottom). The numbers indicate the percentage of DP CD4+CD8+ and SP CD4 + cells in the total thymus.
Figure 7
Figure 7
Deletion of DP cells by anti-CD3 mAb in vivo administration is impaired in dnJNK1 transgenic mice. (A) dnJNK1 transgenic (Tg+) and negative littermate control (NLC) mice (from line 44) were interperitoneally injected with purified anti-CD3 mAb (50 μg/200 μl PBS). 2, 4, or 8 d after injection total thymocytes were stained and CD4 and CD8 expression in the live population was analyzed. The time at 0 d shows the thymocyte distribution in uninjected mice. Numbers represent the percentage of live cells in each gate, CD4+CD8+ (upper gate) and single CD4+ (lower gate). Data shown are from one representative experiment out of three carried out. (B) dnJNK1 transgenic (Tg+) and negative littermate control (NLC) mice from line 45 were injected with anti-CD3 mAb (50 μg/200 μl PBS) and thymocytes were analyzed 2 d later as described in A. (C) Percentage of DP thymocytes (top) and absolute number of DP thymocytes (bottom) in the thymus from negative littermate control (NLC) and dnJNK1 transgenic (Tg+) mice 2 d (left) or 8 d (right) after anti-CD3 mAb in vivo administration. The mean and standard deviations from four (day 2) and three (day 8) independent experiments are presented. (D) dnJNK1 transgenic (Tg+) and negative littermate control (NLC) mice were injected with purified anti-CD3 mAb. The thymus was isolated 2, 4, or 8 d after injection and from control mice (0 d). Total thymocytes were analyzed by forward scatter (FSC) and side scatter (SSC) flow cytometry parameters. Numbers express the percentage of cells in each gate, live cells (right gates) and dead cells (left gates). Data represent one experiment of three performed and represent an independent experiment from the data presented in A.
Figure 7
Figure 7
Deletion of DP cells by anti-CD3 mAb in vivo administration is impaired in dnJNK1 transgenic mice. (A) dnJNK1 transgenic (Tg+) and negative littermate control (NLC) mice (from line 44) were interperitoneally injected with purified anti-CD3 mAb (50 μg/200 μl PBS). 2, 4, or 8 d after injection total thymocytes were stained and CD4 and CD8 expression in the live population was analyzed. The time at 0 d shows the thymocyte distribution in uninjected mice. Numbers represent the percentage of live cells in each gate, CD4+CD8+ (upper gate) and single CD4+ (lower gate). Data shown are from one representative experiment out of three carried out. (B) dnJNK1 transgenic (Tg+) and negative littermate control (NLC) mice from line 45 were injected with anti-CD3 mAb (50 μg/200 μl PBS) and thymocytes were analyzed 2 d later as described in A. (C) Percentage of DP thymocytes (top) and absolute number of DP thymocytes (bottom) in the thymus from negative littermate control (NLC) and dnJNK1 transgenic (Tg+) mice 2 d (left) or 8 d (right) after anti-CD3 mAb in vivo administration. The mean and standard deviations from four (day 2) and three (day 8) independent experiments are presented. (D) dnJNK1 transgenic (Tg+) and negative littermate control (NLC) mice were injected with purified anti-CD3 mAb. The thymus was isolated 2, 4, or 8 d after injection and from control mice (0 d). Total thymocytes were analyzed by forward scatter (FSC) and side scatter (SSC) flow cytometry parameters. Numbers express the percentage of cells in each gate, live cells (right gates) and dead cells (left gates). Data represent one experiment of three performed and represent an independent experiment from the data presented in A.
Figure 8
Figure 8
Antigen-specific induced apoptosis in thymus is impaired in dnJNK1 transgenic mice. (A) Cyt c TCR transgenic mice (NLC) or Cyt c TCR × dnJNK1 double transgenic mice (Tg+) were injected with PBS or a synthetic moth Cyt c peptide (250 μM/200 μl/mouse) for 24 h. Thymocytes were then isolated, stained, and analyzed by flow cytometry for side scatter (SSC) and forward scatter (FSC) flow cytometry. Numbers express the percentage of cells in each gate, live cells (right gates) and dead cells (left gates). (B) CD4 and CD8 expression in live cells from Cyt c TCR transgenic mice (NLC) or Cyt c TCR × dnJNK1 double transgenic mice (Tg+) injected with PBS or a synthetic moth Cyt c peptide for 24 h. Numbers represent the percentage of cells in each gate (DP, CD4+, and DN cells). (C) Absolute number of DP, CD4+, and DN cells in Cyt c TCR transgenic mice (NLC) or Cyt c TCR × dnJNK1 double transgenic mice (Tg+) 24 h after injection with a synthetic moth Cyt c peptide. A total of 40–60 × 106 cells was found in thymuses from both Cyt c TCR transgenic mice and Cyt c TCR × dnJNK1 double transgenic mice before peptide injection. The results are representative of two independent experiments.
Figure 8
Figure 8
Antigen-specific induced apoptosis in thymus is impaired in dnJNK1 transgenic mice. (A) Cyt c TCR transgenic mice (NLC) or Cyt c TCR × dnJNK1 double transgenic mice (Tg+) were injected with PBS or a synthetic moth Cyt c peptide (250 μM/200 μl/mouse) for 24 h. Thymocytes were then isolated, stained, and analyzed by flow cytometry for side scatter (SSC) and forward scatter (FSC) flow cytometry. Numbers express the percentage of cells in each gate, live cells (right gates) and dead cells (left gates). (B) CD4 and CD8 expression in live cells from Cyt c TCR transgenic mice (NLC) or Cyt c TCR × dnJNK1 double transgenic mice (Tg+) injected with PBS or a synthetic moth Cyt c peptide for 24 h. Numbers represent the percentage of cells in each gate (DP, CD4+, and DN cells). (C) Absolute number of DP, CD4+, and DN cells in Cyt c TCR transgenic mice (NLC) or Cyt c TCR × dnJNK1 double transgenic mice (Tg+) 24 h after injection with a synthetic moth Cyt c peptide. A total of 40–60 × 106 cells was found in thymuses from both Cyt c TCR transgenic mice and Cyt c TCR × dnJNK1 double transgenic mice before peptide injection. The results are representative of two independent experiments.
Figure 9
Figure 9
TCR-mediated deletion of DP thymocytes in vitro from dnJNK1 mice. (A) Total thymocytes from dnJNK1 transgenic (Tg+) and negative littermate control (NLC) mice were incubated in the presence of medium (−), or immobilized anti-CD3 (10 μg/ml) plus anti-CD28 (10 μg/ml) mAbs (anti-CD3/ anti-CD28) or Con A (2.5 μg/ ml). After 24 h, the cells were harvested, stained with anti-CD4 and anti-CD8 mAbs, and analyzed by FACS®. The profiles represent CD4 and CD8 expression in live cells. Numbers represent the percentage in each gated population. (B) Total thymocytes from dnJNK1 transgenic (Tg+) and negative littermate control (NLC) mice were incubated in the presence of medium (−) or Con A (2.5 μg/ml). Cell viability was analyzed by trypan blue staining at the indicated times. The results presented are representative of three independent experiments.
Figure 9
Figure 9
TCR-mediated deletion of DP thymocytes in vitro from dnJNK1 mice. (A) Total thymocytes from dnJNK1 transgenic (Tg+) and negative littermate control (NLC) mice were incubated in the presence of medium (−), or immobilized anti-CD3 (10 μg/ml) plus anti-CD28 (10 μg/ml) mAbs (anti-CD3/ anti-CD28) or Con A (2.5 μg/ ml). After 24 h, the cells were harvested, stained with anti-CD4 and anti-CD8 mAbs, and analyzed by FACS®. The profiles represent CD4 and CD8 expression in live cells. Numbers represent the percentage in each gated population. (B) Total thymocytes from dnJNK1 transgenic (Tg+) and negative littermate control (NLC) mice were incubated in the presence of medium (−) or Con A (2.5 μg/ml). Cell viability was analyzed by trypan blue staining at the indicated times. The results presented are representative of three independent experiments.

References

    1. Fink PJ, Bevan MJ. Positive selection of thymocytes. Adv Immunol. 1995;59:99–133. - PubMed
    1. Kisielow P, von Boehmer H. Development and selection of T cells: facts and puzzles. Adv Immunol. 1995;58:87–209. - PubMed
    1. Nossal GJV. Negative selection of lymphocytes. Cell. 1994;76:229–239. - PubMed
    1. Whitmarsh AJ, Davis RJ. Transcription factor AP-1: regulation by mitogen activated protein kinases signal transduction pathways. J Mol Med. 1996;17:2360–2371. - PubMed
    1. Ip YT, Davis RJ. Signal transduction by the c-Jun N-terminal kinase (JNK): from inflammation to development. Curr Opin Cell Biol. 1998;10:205–219. - PubMed

Publication types

MeSH terms