. 1998 Nov 5;396(6706):81-4.
doi: 10.1038/23954.

Type III InsP3 receptor channel stays open in the presence of increased calcium

Affiliations

Type III InsP3 receptor channel stays open in the presence of increased calcium

R E Hagar et al. Nature. .

Abstract

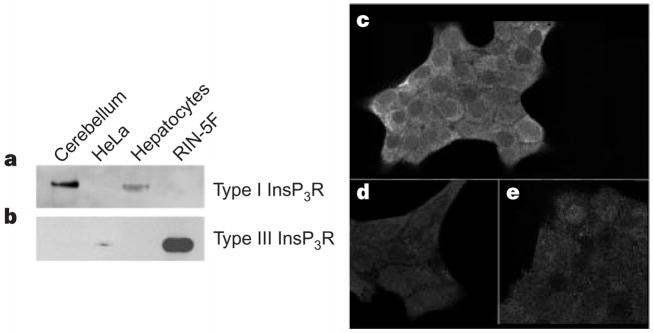
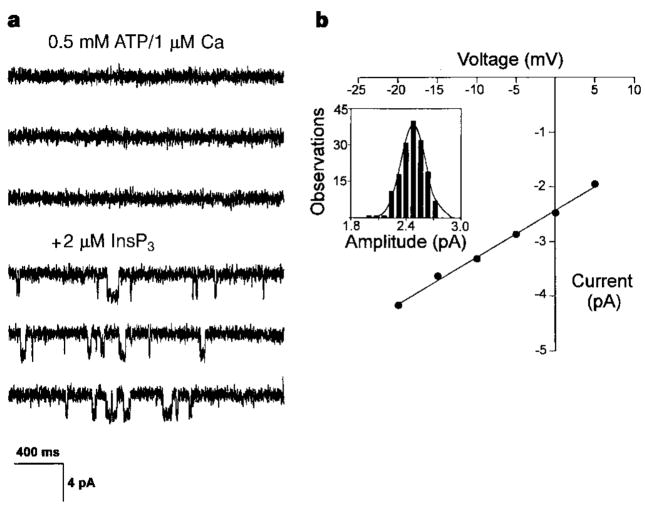
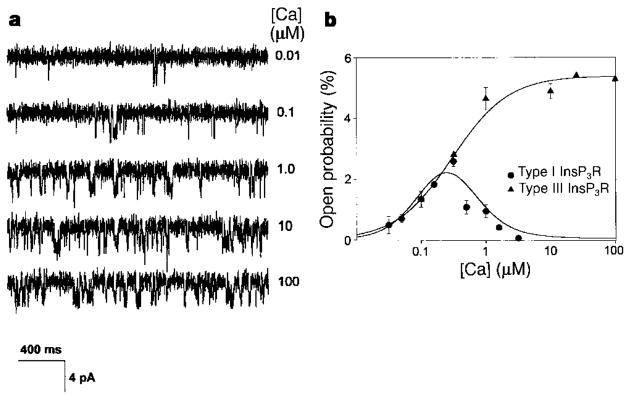
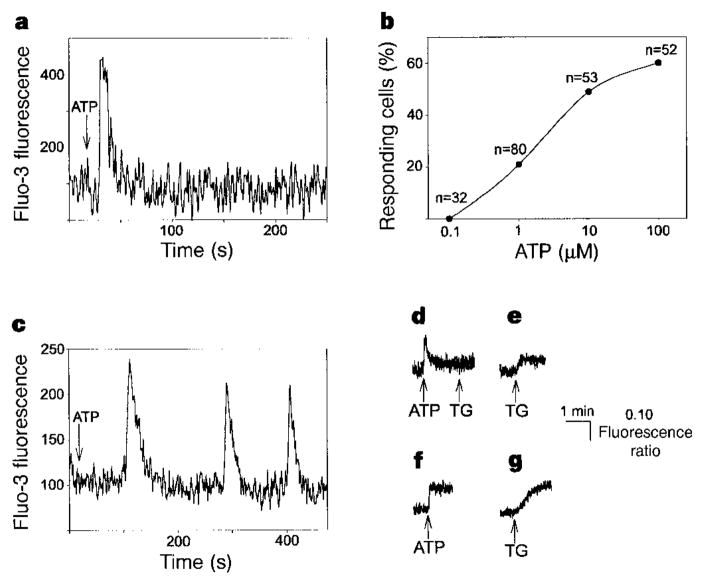
The inositol 1,4,5-trisphosphate receptor (InsP3R) is the main calcium(Ca2+) release channel in most tissues. Three isoforms have been identified, but only types I and II InsP3R have been characterized. Here we examine the functional properties of the type III InsP3R because this receptor is restricted to the trigger zone from which Ca2+ waves originate and it has distinctive InsP3-binding properties. We find that type III InsP3R forms Ca2+ channels with single-channel currents that are similar to those of type I InsP3R; however, the open probability of type III InsP3R isoform increases monotonically with increased cytoplasmic Ca2+ concentration, whereas the type I isoform has a bell-shaped dependence on cytoplasmic Ca2+. The properties of type III InsP3R provide positive feedback as Ca2+ is released; the lack of negative feedback allows complete Ca2+ release from intracellular stores. Thus, activation of type III InsP3R in cells that express only this isoform results in a single transient, but global, increase in the concentration of cytosolic Ca2+. The bell-shaped Ca2+-dependence curve of type I InsP3R is ideal for supporting Ca2+ oscillations, whereas the properties of type III InsP3R are better suited to signal initiation.


Figures

Figure 1
Figure 1
RIN-5F cells preferentially express Type III InsP3R. a, b, Western blots were probed for types I and III InsP3R (a and b, respectively). Dog cerebellum and rat hepatocytes were positive controls for type I InsP3R; HeLa cells were a positive control for type III InsP3R. Lanes were loaded with 30 μg dog cerebellar microsomes (lane 1), 10 μg HeLa cell lysate (lane 2), 30 μg hepatic microsomes (lane 3), and either 30 μg (a) or 5 μg (b) of RIN-5F microsomes (lane 4). c, e, Cellular distribution of type III (c) and type I (e) InsP3R in RIN-5F cells. d, Nonspecific binding.
Figure 2
Figure 2
Type III InsP3R is an InsP3-gated Ca2+ channel. a, InsP3-gated Ca2+ channels from endoplasmic reticulum of RIN-5F cells in planar lipid bilayers. In the absence of InsP3, channel activity was not observed (top three traces). Addition of 2 μM InsP3 to the cytoplasmic side induced channel activity (bottom three traces). Channel openings are shown as downward deflections from baseline. Ruthenium red (2 μM) was present to block ryanodine receptors. b, Current–voltage relationship of type III InsP3R. Inset shows an amplitude histogram at 0 mV for one experiment. Values plotted in the I–V curve represent the mean for three experiments. Standard errors for data points, which range from 0.02 to 0.05 pA, are too small to be seen.
Figure 3
Figure 3
Single channel open probability for type I and type III InsP3R as a function of Ca2+ concentration. a, Channel activity for type III InsP3R in the presence of 2 μM InsP3, 0.5 mM ATP, 0.5 mM EGTA, 2 μM ruthenium red, and at 0 mV. Channel openings are shown as downward deflections. b, Single channel open probability of type I InsP3R (circles) and type III InsP3R (triangles). Data points for type I InsP3R were taken from ref.. Data for three experiments are shown for type III InsP3R. Individual points with error bars are the mean ± s.e.m. for n = 2 (1 and 10 μM Ca2+) or n = 3 (0.01 and 0.1 μM Ca2+).
Figure 4
Figure 4
Ca2+ signalling patterns in RIN-5F cells and rat hepatocytes. a, Stimulation of a RIN-5F cell with 100 μM ATP induces a single intracellular Ca2+ transient. b, Dose–response curve for RIN-5F cells stimulated with ATP. Values indicate total numbers of cells stimulated. c, Stimulation of an hepatocyte with 1 μM ATP induces Ca2+ oscillations. d, ATP (100 μM) induces a single transient increase in Ca2+ in RIN-5F populations (peak change in fluorescence ratio, ΔR = 0.20 ± 0.01; n = 6). Subsequent treatment with thapsigargin (TG; 2 μM) has little effect on Ca2+R = 0.03 ± 0.01; n = 6). e, Thapsigargin alone (2 μM) increases Ca2+ in RIN-5F cells (ΔR = 0.08 ± 0.01; n = 6). f, ATP (100 μM) induces a rapid, sustained increase in Ca2+ in hepatocyte populations (ΔR = 0.13 ± 0.02; n = 7). g, Thapsigargin (2 μM) increases Ca2+ in hepatocytes like ATP alone (ΔR = 0.10 ± 0.02; n = 7).
Figure 5
Figure 5
Subcellular Ca2+ release differs between RIN-5F and SKHep1 cells. a, confocal image of a RIN-5F cell. b, Pseudocolour image of the cell loaded with Fluo-3. The same pseudocolour scale was used for b, c, and fh. c, Line scan collected along the line indicated in b after flash photolysis (λ) of caged InsP3. Ca2+ increases throughout the cell after photorelease of InsP3 (representative of 13 experiments with flash duration 50–100 ms). No Ca2+ increase was detected in 6 experiments with flash duration <50 ms. Spatial resolution, 0.26 μm per pixel; temporal resolution, 6 ms per pixel. d, Release of caged InsP3 results in a global increase in Ca2+. Trace duration in d, i and j is 2 s. e, f, Confocal (e) and pseudocolour (f) images of an SKHep1 cell. g, h, Confocal line scans of the cell during 30 and 60 ms flashes to photolyse caged InsP3. A response is detected in only the left side of the cell after a short flash (g), and throughout the cell after a long flash (h). Responses were absent or minimal in only part of an SKHep1 cell in 7 experiments (flash duration, 3–50 ms), whereas global Ca2+ increases were seen in 12 experiments (flash duration, 5–60 ms). i, An increase occurs on the left side of the cell in g (1), but not on the right (2). j, After more photorelease of InsP3 (h), similar Ca2+ increases occur at the same two subcellular locations.

References

    1. Furuichi T, et al. Primary structure and functional expression of the inositol 1,4,5-trisphosphate-binding protein P400. Nature. 1989;342:32–38. - PubMed
    1. Mignery G, Sudhof TC, Takei K, De Camilli P. Putative receptor for inositol 1,4,5-trisphosphate similar to ryanodine receptor. Nature. 1989;342:192–195. - PubMed
    1. Sudhof TC, Newton CL, Archer BT, Ushkaryov YA, Mignery GA. Structure of a novel InsP3 receptor. EMBO J. 1991;10:3199–3206. - PMC - PubMed
    1. Blondel O, Takeda J, Janssen H, Seino S, Bell GI. Sequence and functional characterization of a third inositol trisphospate receptor subtype, IP3R-3, expressed in pancreatic islets, gastrointestinal tract, and other tissues. J Biol Chem. 1993;268:11356–11363. - PubMed
    1. Maranto AR. Primary structure, ligand binding, and localization of the human type 3 inositol 1,4,5-trisphosphate receptor expressed in intestinal epithelium. J Biol Chem. 1994;269:1222–1230. - PubMed

Publication types