. 1998 Nov 16;143(4):1087-99.
doi: 10.1083/jcb.143.4.1087.

The transcription factor AP-1 is required for EGF-induced activation of rho-like GTPases, cytoskeletal rearrangements, motility, and in vitro invasion of A431 cells

Affiliations

The transcription factor AP-1 is required for EGF-induced activation of rho-like GTPases, cytoskeletal rearrangements, motility, and in vitro invasion of A431 cells

A Malliri et al. J Cell Biol. .

Abstract

Human squamous cell carcinomas (SCC) frequently express elevated levels of epidermal growth factor receptor (EGFR). EGFR overexpression in SCC-derived cell lines correlates with their ability to invade in an in vitro invasion assay in response to EGF, whereas benign epidermal cells, which express low levels of EGFR, do not invade. EGF-induced invasion of SCC-derived A431 cells is inhibited by sustained expression of the dominant negative mutant of c-Jun, TAM67, suggesting a role for the transcription factor AP-1 (activator protein-1) in regulating invasion. Significantly, we establish that sustained TAM67 expression inhibits growth factor-induced cell motility and the reorganization of the cytoskeleton and cell-shape changes essential for this process: TAM67 expression inhibits EGF-induced membrane ruffling, lamellipodia formation, cortical actin polymerization and cell rounding. Introduction of a dominant negative mutant of Rac and of the Rho inhibitor C3 transferase into A431 cells indicates that EGF-induced membrane ruffling and lamellipodia formation are regulated by Rac, whereas EGF-induced cortical actin polymerization and cell rounding are controlled by Rho. Constitutively activated mutants of Rac or Rho introduced into A431 or A431 cells expressing TAM67 (TA cells) induce equivalent actin cytoskeletal rearrangements, suggesting that the effector pathways downstream of Rac and Rho required for these responses are unimpaired by sustained TAM67 expression. However, EGF-induced translocation of Rac to the cell membrane, which is associated with its activation, is defective in TA cells. Our data establish a novel link between AP-1 activity and EGFR activation of Rac and Rho, which in turn mediate the actin cytoskeletal rearrangements required for cell motility and invasion.


Figures
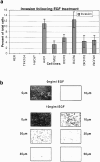
Figure 1
Figure 1
Invasion response of normal epidermal and SCC-derived cell lines. (a) Quantitative analysis of invasion of primary keratinocytes (HEK), immortalized keratinocytes (TFK104 and HaCaT), and various SCC-derived cell lines in response to 10 ng/ml EGF. Invasion assay results were quantitated as described elsewhere (Hennigan et al., 1994; Lamb et al., 1997a ) with a Bio-Rad program (Comos) and represent the average from at least three independent experiments. (b) A431 invasion in response to EGF. Shown are confocal images of propidium iodide–stained cell nuclei at the bottom of the filter (0 μm), top of the filter (10 μm), and at various heights as indicated through the Matrigel in the absence (top) or presence (bottom) of 10 ng/ml EGF.
Figure 2
Figure 2
Expression of TAM67 inhibits AP-1 transactivation and invasion of A431 cells. (a) Western blot analysis of A431 cells, two NA clones, and three TA clones using a polyclonal antibody against c-Jun to reveal expression of TAM67. (b) Measurement of AP-1 directed CAT expression in NA and TA cells as described in Materials and Methods. Columns show the average for three independent experiments. (c) Quantitative analysis of chemotaxis and invasion of A431, NA, and TA cells in response to EGF as described in Materials and Methods and elsewhere (Hennigan et al., 1994; Lamb et al., 1997a ). Columns show the average for four independent experiments. (d) Confocal images of propidium iodide stained cell nuclei of NA13 and TA37 cells at the bottom (0 μm) and at a distance 30 μm from the bottom of the filter (i.e., 20 μm into the Matrigel) after EGF stimulation.
Figure 2
Figure 2
Expression of TAM67 inhibits AP-1 transactivation and invasion of A431 cells. (a) Western blot analysis of A431 cells, two NA clones, and three TA clones using a polyclonal antibody against c-Jun to reveal expression of TAM67. (b) Measurement of AP-1 directed CAT expression in NA and TA cells as described in Materials and Methods. Columns show the average for three independent experiments. (c) Quantitative analysis of chemotaxis and invasion of A431, NA, and TA cells in response to EGF as described in Materials and Methods and elsewhere (Hennigan et al., 1994; Lamb et al., 1997a ). Columns show the average for four independent experiments. (d) Confocal images of propidium iodide stained cell nuclei of NA13 and TA37 cells at the bottom (0 μm) and at a distance 30 μm from the bottom of the filter (i.e., 20 μm into the Matrigel) after EGF stimulation.
Figure 3
Figure 3
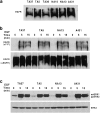
(a) NA and TA clones express similar levels of EGFR. Western blot analysis of EGFR in A431 cells, two NA, and three TA clones using a sheep anti–human EGFR polyclonal antibody. (b) EGF-induced EGFR autophosphorylation is equivalent in A431, NA, and TA clones. The top panel represents a Western blot for phoshotyrosine, using an anti-phosphotyrosine–specific mouse mAb, after EGF treatment of A431 cells, NA, and TA clones. The bottom panel represents a similar Western blot probed with sheep polyclonal anti-EGFR antiserum to show equivalent loading as well as similar levels of EGFR expression between the different clones. (c) EGF stimulates phosphorylation of MAPK in A431, NA, and TA clones. The top panel represents MAPK phosphorylation detected using an antibody specific for the phosphorylated forms of MAPK. The bottom panel represents a similar Western blot probed with an anti-ERK2–specific antibody to demonstrate equal loading.
Figure 4
Figure 4
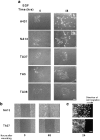
Expression of TAM67 inhibits motility of A431 cells. (a) Colonies of cells were treated with EGF as described in Materials and Methods. Representative A431, NA, and TA colonies, photographed using a phase contrast microscope, are shown before and 48 h after the addition of 10 ng/ml EGF. (EGF was also used at concentrations of 2 and 5 ng/ml with similar results obtained.) Insets show higher magnification images of two different motile cells. (b) Wounding assays for NA13 and TA37 cells. Wounds were created in monolayers of NA13 or TA37 cells as described in Materials and Methods and photographed immediately and 48 hours later. (c) Wounds created in monolayers of NA13 and TA37 cells grown on glass coverslips were fixed and stained for F-actin with phalloidin 24 after wounding. Photographs show cells at the edge of the wound. Results for one of four independent experiments are shown. Bars: (a, c) 20 μm; (b) 100 μm.
Figure 5
Figure 5
EGF treatment leads to lamellipodia formation, membrane ruffling, and cortical actin polymerization in NA but not TA cells. Confocal micrographs of rhodamine-phalloidin stained NA13 and TA37 cells before (a and b), 5 min (c and d), and 15 min (e and f) after the addition of EGF. The main micrograph in c shows a z-section towards the top of the cells to reveal membrane ruffles (arrowheads), whereas the insert shows an enhanced z-section at the base of the cells to reveal lamellipodia (arrowhead). No z-section through TA cells revealed ruffles or lamellipodia (d) even when enhanced to the same degree as the inset in c (d, inset). Bottom panels of a, b, e, and f show optical sections made perpendicular to the substratum through the cells of the colonies above, at the position of the colony indicated by the arrow. (Cells were treated with 100 ng/ml EGF. Similar results were also obtained with 10 ng/ml.) Photomicrographs shown are representative of four independent experiments. Bar, 10 μm.
Figure 6
Figure 6
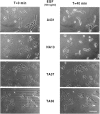
A431, NA13, but not TA36 and TA37 cells contract/ round up in response to EGF. The response of cells to EGF was recorded by time-lapse digital microscopy for 5 min before and 40 min after the addition of EGF as described in Materials and Methods. (Cells were treated with 100 ng/ml EGF. Similar results were also obtained with 10 ng/ml.) Photomicrographs shown are representative of four independent experiments. Bar, 20 μm.
Figure 7
Figure 7
Inactivation of Rac and Rho in NA13 cells inhibits EGF-induced actin rearrangements. Confocal micrographs of cells microinjected with an expression construct encoding a myc-tagged version of RacN17 (a–d) or with C3 transferase and FITC-dextran (e and f), treated with EGF for either 5 min (a and b) or 15 min (c–f), and costained either for myc and phalloidin (cells in a–d) or for phalloidin alone (e and f). Microinjected cells were detected either by myc-tag specific mAb (9E10)-staining (b and d) or the presence of FITC-dextran (f). Arrowheads in a point to lamellipodia and membrane ruffles in noninjected cells, and in c and e indicate noninjected cells with cortical F-actin. A representative field of cells for at least three independent experiments is shown for each treatment. Bar, 10 μm.
Figure 8
Figure 8
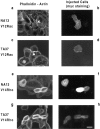
Activated forms of Rac and Rho function equally in NA13 and TA37 cells. Confocal micrographs of cells microinjected with expression constructs encoding myc-tagged versions of either V12Rac (a–d) or V14Rho (e–h) and stained for the myc-tag using a myc specific mAb (9E10; to detect the injected cells) and phalloidin (for the visualization of polymerized actin). Arrowheads in a and c indicate colocalization of Rac and F-actin at sites of cell–cell contacts. A representative field of cells for at least three independent experiments is shown for each treatment. Bar, 10 μm.
Figure 9
Figure 9
(A) Rac translocates to membrane ruffles in NA13 but not TA37 cells after 5 min treatment with EGF. Confocal micrographs are shown for NA13 and TA37 cells stained using a mouse anti-Rac mAb. (a and b) NA13 and TA37 cells untreated; (c and e) NA13 cells treated with 100 ng/ml EGF for 5 min; (d and f) TA37 cells treated with 100 ng/ml EGF for 5 min. A representative field of cells for at least three independent experiments is shown. (B) Western blot analysis demonstrating equivalent levels of expression of Rac and Rho in A431, NA, and TA cells. Bar, 10 μm.
Figure 10
Figure 10
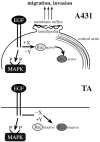
A schematic representation of TAM67 inhibition of EGF-induced cytoskeletal rearrangements. (Top) EGF treatment of A431 cells activates Rac and subsequently Rho. In turn, activated Rac and Rho regulate the cytoskeletal rearrangements required for cell migration and hence invasion. EGF-induced activation of Rac and Rho requires the function of upstream activators(s) X and possibly decreased function of inhibitor(s) Y. (Bottom) Expression of TAM67 inhibits EGF-induced activation of Rac and Rho and thus blocks migration and invasion. EGF fails to activate Rac and Rho in TA cells because expression of TAM67 suppresses the expression or activity of activators (X) and possibly increases the activity of inhibitors (Y).

Similar articles

Cited by

References

    1. Anand-Apte B, Zetter BR, Viswanathan A, Qiu RG, Chen J, Ruggieri R, Symons M. Platelet-derived growth factor and fibronectin-stimulated migration are differentially regulated by the Rac and extracellular signal-regulated kinase pathways. J Biol Chem. 1997;272:30688–30692. - PubMed
    1. Azuma T, Witke W, Stossel TP, Hartwig JH, Kwiatkowski DJ. Gelsolin is a downstream effector of rac for fibroblast motility. EMBO (Eur Mol Biol Organ) J. 1998;17:1362–1370. - PMC - PubMed
    1. Birchmeier W. E-cadherin as a tumor (invasion) suppressor gene. Bioessays. 1995;17:97–99. - PubMed
    1. Bretscher A, Reczek D, Berryman M. Ezrin: a protein requiring conformational activation to link microfilaments to the plasma membrane in the assembly of cell surface structures. J Cell Sci. 1997;110:3011–3018. - PubMed
    1. Brown PH, Alani R, Preis LH, Szabo E, Birrer MJ. Suppression of oncogene-induced transformation by a deletion mutant of c-jun. Oncogene. 1993;8:877–886. - PubMed

Publication types

MeSH terms