. 1998 Nov 1;33(3):376-82.
doi: 10.1002/(sici)1097-0320(19981101)33:3<376::aid-cyto13>3.0.co;2-q.

Activation of nuclear factor kappa B (NF-kappaB) assayed by laser scanning cytometry (LSC)

Affiliations

Activation of nuclear factor kappa B (NF-kappaB) assayed by laser scanning cytometry (LSC)

A Deptala et al. Cytometry. .

Abstract

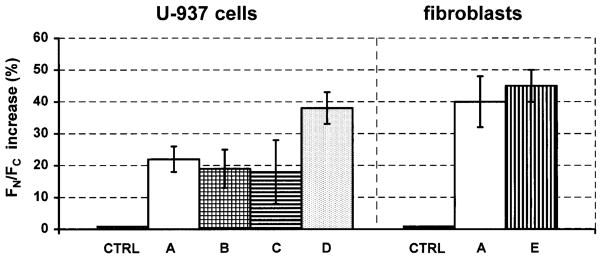
Nuclear factor kappa B (NF-kappaB)/rel is the family of ubiquitous transcriptional activators involved in regulation of diverse immune and inflammatory responses. It also plays a role in control of cell growth and apoptosis. In its inactive form NF-kappaB remains in the cytoplasm sequestered through interaction with IkappaB protein. Rapid translocation of NF-kappaB from cytoplasm to nucleus that occurs in response to extracellular signals is considered to be a hallmark feature of its activation. The translocation of NF-kappaB in HL-60, U-937 and Jurkat leukemic cells as well as in human fibroblasts induced by tumor necrosis factor alpha (TNF-alpha) or phorbol myristate acetate (PMA) was presently measured by laser scanning cytometry (LSC). NF-kappaB was detected immunocytochemically with FITC-tagged antibody and its presence in the nucleus vis-a-vis cytoplasm was monitored by measuring the green fluorescence integrated over the nucleus, which was counterstained with propidium iodide (PI), and over the cytoplasm, respectively. Activation of NF-kappaB led to a rapid increase in NF-kappaB-associated fluorescence measured over the nucleus (FN) concomitant with a decrease in fluorescence over the cytoplasm (F(C)), which was reflected by an increase in F(N)/F(C) ratio. This rapid assay of NF-kappaB activation can be combined with morphological identification of the activated cells or with their immunophenotype. Bivariate analysis of NF-kappaB expression versus cellular DNA content makes it possible to correlate its activation with the cell cycle position. The described method has a potential to be used as a functional assay to monitor intracellular translocation of other transcriptional activators such as p53 tumor suppressor protein or signal transduction molecules.


Figures

Fig. 1
Fig. 1
Measurement of nuclear and cytoplasmic NF-κB- associated fluorescence by LSC. Green (FITC) fluorescence was measured separately over the nucleus (FN) and cytoplasm (FC). FN (integrated fluorescence) was measured within the area outlined by the “integration contour” which was located in all experiments except these shown in Figure 6, four pixels (i) outside the “threshold contour”. The latter was the red fluorescence (PI) triggering threshold, placed at one-third distance from the edge of the nucleus towards the nucleus center, as described in the manual for LSC. FC (integrated “peripheral fluorescence”) was measured within the rim of cytoplasm 8 pixels wide (p) located outside the measured nuclear area. The background green fluorescence (b) was automatically measured outside the cell (15) and was subtracted from both, nuclear and cytoplasmic green fluorescence, to obtain final values of FN and FC, respectively.
Fig. 2
Fig. 2
Changes in FN, FC and FN/FC ratio of U-937 cells treated with 10 ng/ml of TNF-α for 1 h. Panels A and B show scattergrams representing FN and FC, respectively, versus DNA content prior to the treatment; panels C and D, FN and FC, respectively, after the treatment. Panel E shows the change in FN, panel F, the change in FN/FC. The G1, S and G2/M cells were sorted based on differences in their DNA content for morphological evaluation. Bars indicate FN/FC of the cells gated in G1, S and G2/M based on differences in their PI fluorescence (DNA content) as shown in panel A. Striped bars, prior to TNF-α treatment; shaded bars, after the treatment.
Fig. 3
Fig. 3
Changes in FN and FN/FC of HL-60 cells (panels A, B), human fibroblasts (C, D) and Jurkat cells (E, F) treated with 10 ng/ml of TNF-α for 1 h. Panels G and H show FN and FN/FC of U-937 cells pretreated with TLCK for 1 h and then treated with TNF-α for an additional 1 h.
Fig. 4
Fig. 4
Percent increase in FN and FN/FC ratio of U-937, HL-60, fibroblasts and Jurkat cells treated with 10 (U-937, HL-60, Jurkat) or 20 ng/ml (fibroblasts) of TNF-α for 1 h. The last set of bars shows represents Jurkat cells pretreated with TLCK to inhibit activation of NF-κB (20).
Fig. 5
Fig. 5
Changes in FN and FN/FC during incubation of Jurkat cells with 20 ng/ml of TNF-α for up to 120 min.
Fig. 6
Fig. 6
Effect of a variation in the setting that defines conditions of the measurement of nuclear versus cytoplasmic fluorescence on the degree of increase of FN/FC induced by activation of NF-κB. To activate NF-κB U-937 cells were treated with 40 nM PMA for 45 min while fibroblasts with 20 ng/ml of TNF-α for1 h. Their FN and FC before and after the treatment were measured under different settings of the threshold contour (tc), integration contour (i) and different width of the peripheral contour (width of the measured cytoplasmic rim; p) as marked in Figure 1. At setting A, tc was at 300 units, i was 2 pixels ouside tc and p was 8 pixels. At setting B, tc was at 500 units, i was 2 pixels and p was 8 pixels. At setting C, tc was at 300 units, i was 4 pixels and p was 4 pixels. At setting D, the tc was at 500 units, i was 4 pixels and p was 4 pixels. At setting E, tc was at 300 units, i was 4 pixels and p was 8 pixels. Control (CTRL) represents analysis of the cells which were treated with the respective diluents instead of PMA or TNF-α; their FN and FC was measured at setting A. Mean values of triplicate cultures ± SE.

References

    1. Baeuerle PA, Baltimore D. NF-κB: Ten years after. Cell. 1996;87:13–20. - PubMed
    1. Baeuerle PA, Henkel T. Function and activation of NF-κB in the immune system. Annu Rev Immunol. 1994;12:141–179. - PubMed
    1. Baldwin AS., Jr The NF-κB and IκB proteins: New discoveries and insights. Annu Rev Immunol. 1996;14:649–681. - PubMed
    1. Bedner E, Burfeind P, Gorczyca W, Melamed MR, Darzynkiewicz Z. Laser scanning cytometry distingushes lymphocytes, monocytes and granulocytes by differences in their chromatin structure. Cytometry. 1997;29:191–196. - PubMed
    1. Bedner E, Burfeind P, Hsieh T-C, Wu JM, Augero-Rosenfeld M, Melamed MR, Horowitz HW, Wormser GP, Darzynkiewicz Z. Cell cycle effects and induction of apoptosis caused by infection of HL-60 cells with human granulocytic Egrlichiosis (HGE) pathogen measured by flow and laser scanning cytometry (LSC) Cytometry. 1998;33:47–55. - PubMed

Publication types