. 1998 Dec 1;18(23):9573-84.
doi: 10.1523/JNEUROSCI.18-23-09573.1998.

Single-cell RT-PCR and functional characterization of Ca2+ channels in motoneurons of the rat facial nucleus

Affiliations

Single-cell RT-PCR and functional characterization of Ca2+ channels in motoneurons of the rat facial nucleus

T D Plant et al. J Neurosci. .

Abstract

Voltage-dependent Ca2+ channels are a major pathway for Ca2+ entry in neurons. We have studied the electrophysiological, pharmacological, and molecular properties of voltage-gated Ca2+ channels in motoneurons of the rat facial nucleus in slices of the brainstem. Most facial motoneurons express both low voltage-activated (LVA) and high voltage-activated (HVA) Ca2+ channel currents. The HVA current is composed of a number of pharmacologically separable components, including 30% of N-type and approximately 5% of L-type. Despite the dominating role of P-type Ca2+ channels in transmitter release at facial motoneuron terminals described in previous studies, these channels were not present in the cell body. Remarkably, most of the HVA current was carried through a new type of Ca2+ channel that is resistant to toxin and dihydropyridine block but distinct from the R-type currents described in other neurons. Using reverse transcription followed by PCR amplification (RT-PCR) with a powerful set of primers designed to amplify all HVA subtypes of the alpha1-subunit, we identified a highly heterogeneous expression pattern of Ca2+ channel alpha1-subunit mRNA in individual neurons consistent with the Ca2+ current components found in the cell bodies and axon terminals. We detected mRNA for alpha1A in 86% of neurons, alpha1B in 59%, alpha1C in 18%, alpha1D in 18%, and alpha1E in 59%. Either alpha1A or alpha1B mRNAs (or both) were present in all neurons, together with various other alpha1-subunit mRNAs. The most frequently occurring combination was alpha1A with alpha1B and alpha1E. Taken together, these results demonstrate that the Ca2+ channel pattern found in facial motoneurons is highly distinct from that found in other brainstem motoneurons.


Figures
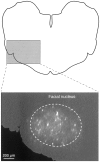
Fig. 1.
Fig. 1.
Localization of the facial nucleus by retrograde labeling. Scheme of a transverse brainstem slice obtained from video micrographs in transmitted light. The enlarged region in epifluorescence shows the facial nucleus stained with DiI injected into the facial nerve 2 d previously. To aid the localization of the nucleus, the edge of the slice measured in transmitted light (dark area at left) has been superimposed on the fluorescence image.
Fig. 2.
Fig. 2.
Biophysical properties of Ca2+channel currents. Ca2+ channel currents measured during 250 msec steps to the potentials (Vt) indicated from holding potentials (Vh) of −80 mV (A) and −60 mV (B).C, I–V relations at −80 mV (•) and −60 mV (○) from the same motoneuron as A andB. D, Inactivation curves measured using a test pulse to −40 mV after a 500 msec conditioning pulse to potentials between −100 and −50 mV (■), and using a test pulse to −10 mV after a 15 sec conditioning depolarization to potentials between −100 and +10 mV (•). The points were fitted with a Boltzmann distribution: I/Imax = {(1 − N/(1 + exp ((VV1/2)/k))} +N, where k is the slope parameter,V1/2 is the potential at which the current was inactivated by 50%, and N is the noninactivating component of current. The respective values forV1/2 and k were −71.3 mV and 6.25 at −40 mV and −45.4 mV and 13.5 at −10 mV. Also shown is the mean activation curve, measured from tail currents at the end of 250 msec pulses (▴). The fit parameters from the fitted Boltzmann distribution (as above) were −25.9 mV and −8.9 forV1/2 and k, respectively.
Fig. 3.
Fig. 3.
Molecular analysis of Ca2+channel α1-subunits in single neurons.Top, Positions of primers on the coding sequence for the α1-subunits of the voltage-gated Ca2+channel. The shaded regions indicate the locations of the putative transmembrane domains. Middle, Sequences of the up and lo primers indicating the positions of mismatches where appropriate. Bottom, Details of the restriction analysis for the detection of individual α1-subunits after a second round of PCR amplification using the primers described for the first PCR amplification. The figure show the positions of the restriction sites and the lengths of the expected fragments.
Fig. 4.
Fig. 4.
RT-PCR analysis of Ca2+ channel α1-subunits.A, Ethidium bromide-stained gel (1.5%) showing the amplified fragments produced when 10, 1, 0.1, and 0.01 ng of input cDNA from whole-brain total RNA were used in the PCR. The lanes markedM and W are the molecular weight marker φX174/HaeII and the RT-PCR without RNA, respectively.B, Ethidium bromide-stained gel (1.5%) showing the absence of amplification of genomic DNA. Lane 1, RT-PCR with 10 ng of total RNA from rat brain. Lane 2, RT-PCR with 10 ng of total RNA from whole brain, but without reverse transcriptase. Lane 3, PCR with 200 ng of genomic DNA.Lane 4, RT-PCR without RNA. M, Molecular weight marker. C, Analysis of Ca2+channel α1-subunits in RNA from whole brain (adult). The lane marked A-S shows the band corresponding to the fragments obtained after the first PCR. Lanes marked A, B, C, D, E, and S show the fragments obtained after a second PCR reaction and restriction digest with the enzymesDrdI, BpmI, HincII,AflII, AccI, and ClaI, respectively.
Fig. 5.
Fig. 5.
Single-cell RT-PCR analysis of Ca2+ channel α1-subunit RNA expression in single neurons. Agarose gel electrophoresis of the cDNA amplified products from four single cells: (A) a cerebellar Purkinje neuron (Pn2), (B) a granule cell of the hippocampal dentate gyrus (Gc5), and (C,D) motoneurons from the facial nucleus (Mn24 and Mn20, respectively). Lanes marked M show the molecular weight marker φX174/HaeIII. The lanes markedA-S show the band corresponding to the fragments obtained after the first PCR. Lanes marked A, B, C, D, E, and S show the fragments obtained after a second PCR reaction and restriction digest with the enzymesDrdI, BpmI, HincII,AflII, AccI and ClaI, respectively.
Fig. 6.
Fig. 6.
Inhibition of the Ca2+channel current by ω-CTx-GVIA and nitrendipine. A,Left, Currents recorded during 20 msec potential steps from a Vh of −80 to −10 mV at the times indicated in the plot of peak current amplitude at −10 mV against time (right) illustrating the irreversible inhibition by ω-CTx-GVIA. B, Left, Currents recorded during 20 msec potential steps from a Vh of −80 mV to −10 mV before (3) and after (4) the addition of nitrendipine (10 μm). Right, Plot of peak current amplitude at −10 mV against time illustrating the inhibition by nitrendipine (10 μm). B is a continuation of the experiment in A.
Fig. 7.
Fig. 7.
Lack of effect of ω-Aga-IVA on Ca2+ channel currents in motoneurons but clear effects in cerebellar Purkinje neurons. A, B, Effects of ω-Aga-IVA in motoneurons. A, Currents recorded at −10 mV at the times indicated in B, before (1) and during (2) the application of ω-Aga-IVA to the bath solution. B, Plot of the peak current against time showing that 100 nmω-Aga-IVA had no effect on the Ca2+ channel current. C, D, Inhibition of Ca2+channel currents in cerebellar Purkinje neurons by ω-Aga-IVA.C, Ba2+ currents recorded during 20 msec impulses to −10 mV from a holding potential of −70 mV in a Purkinje neuron in a cerebellar slice from a 4-d-old rat. The currents were recorded at the times indicated in D, in the control (1), after inhibition by 100 nm ω-Aga-IVA (2), after washout of toxin from the bath and one train of 10 pulses of 60 msec duration to +130 mV (3), and after a second and third train of depolarizations (4 and 5, respectively). D, Plot of peak current at −10 mV against time showing the time course of current block by ω-Aga-IVA and its removal by strong depolarizations. The trains of depolarizations were applied at the times indicated by thefilled triangles.
Fig. 8.
Fig. 8.
Block of the Ca2+ channel current in motoneurons by ω-CTx-MVIIC. A, Inhibition of the Ca2+ channel current at −10 mV by 1 μm ω-CTx-MVIIC. The current records (top part) were measured at the times indicated in plot of current amplitude at −10 mV against time during the experiment (bottom part). The toxin was added to the bath in the absence of perfusion. B, Lack of effect of ω-CTx-MVIIC when applied after ω-CTx-GVIA. In this experiment, ω-CTx-GVIA (1 μm) was added to the bath. After a stable level of inhibition was reached, ω-CTx-MVIIC (1 μm) was also added. Peak currents were recorded at −10 mV during steps from −80 mV.
Fig. 9.
Fig. 9.
Scheme of a facial motoneuron summarizing the proposed subcellular distribution of Ca2+ channel types from functional studies and the α1-subunit mRNA expression pattern from RT-PCR. + indicates the proportion of cells in which the subunit was detected.

References

    1. Bargas J, Howe A, Eberwine J, Cao Y, Surmeier DJ. Cellular and molecular characterization of Ca2+ currents in acutely isolated, adult rat neostriatal neurons. J Neurosci. 1994;14:6667–6686. - PMC - PubMed
    1. Catterall WA. Structure and function of voltage-gated ion channels. Annu Rev Biochem. 1995;64:493–531. - PubMed
    1. Chin H, Krall M, Kim H-L, Kozak CA, Mock B. The gene for the α1 subunit of the skeletal muscle dihydropyridine-sensitive calcium channel (Cchl1a3) maps to mouse chromosome 1. Genomics. 1992;14:1089–1091. - PubMed
    1. Dunlap K, Luebke JI, Turner TJ. Exocytotic Ca2+ channels in mammalian central neurons. Trends Neurosci. 1995;18:89–98. - PubMed
    1. Edwards FA, Konnerth A, Sakmann B, Takahashi T. A thin slice preparation for patch clamp recordings from neurones of the mammalian central nervous system. Pflügers Arch. 1989;414:600–612. - PubMed

Publication types

MeSH terms

LinkOut - more resources