

Non-additive interaction between nicotinic cholinergic and P2X purine receptors in guinea-pig enteric neurons in culture
- PMID: 9824710
- PMCID: PMC2231316
- DOI: 10.1111/j.1469-7793.1998.685ba.x
Non-additive interaction between nicotinic cholinergic and P2X purine receptors in guinea-pig enteric neurons in culture
Abstract
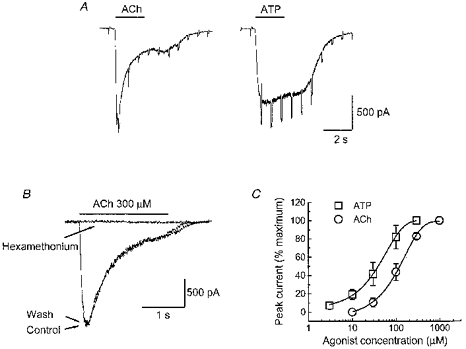
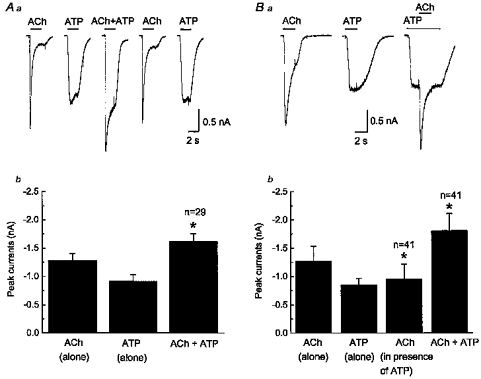
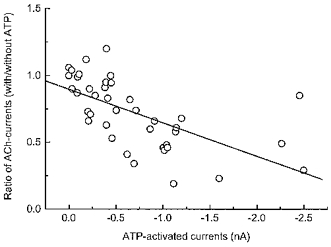
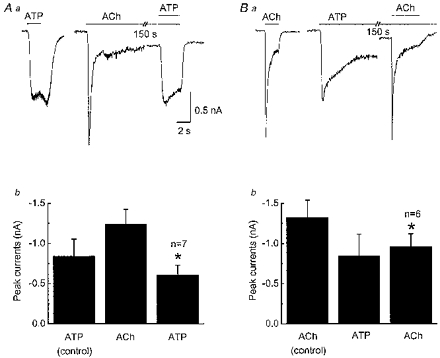
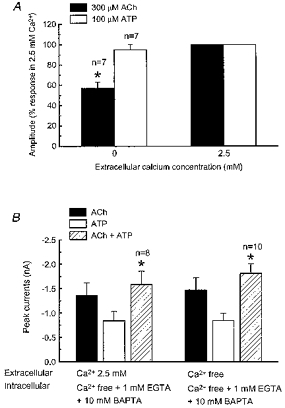
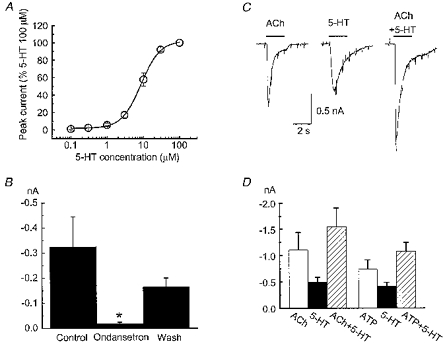
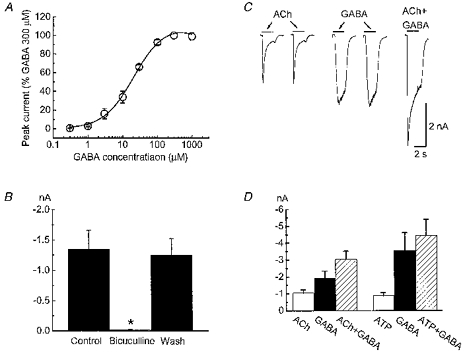
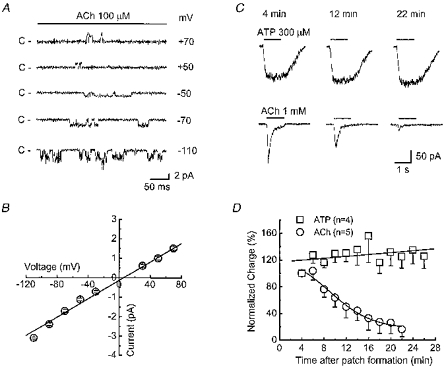
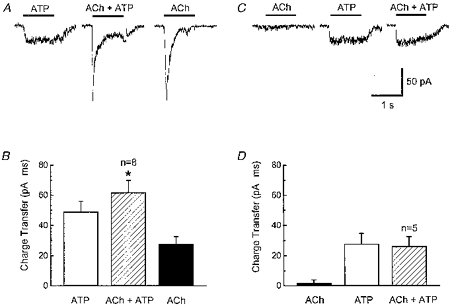
1. Acetylcholine (ACh)-activated currents and their interaction with ATP-activated currents were studied in primary cultures of myenteric neurons from guinea-pig small intestine using patch clamp techniques. Peak currents caused by co-application of ACh (1 mM) and ATP (300 microM) were 78 +/- 2 % of the sum of currents activated by each agonist alone (P < 0.05, n = 29). Reversal potentials measured during co-application of ACh and ATP did not differ from those measured during application of ACh or ATP alone. Addition of BAPTA (10 mM) to the pipette solution or replacement of extracellular Ca2+ with Na+ did not prevent occlusion. 2. Responses caused by co-application of 5-HT (300 microM), acting at 5-HT3 receptors, and ACh (3 mM) or ATP (1 mM) were additive (94 +/- 3 or 96 +/- 4 %, respectively, of the sum of currents activated by 5-HT and ACh or ATP alone; P > 0.05). Currents caused by GABA (1 mM), acting at GABAA receptors, and ACh (3 mM) or ATP (1 mM) were also additive (105 +/- 4 or 100 +/- 3 %, respectively, of the sum of currents activated by GABA and ACh or GABA and ATP applied separately; P > 0. 05). 3. Single channel currents caused by ACh and ATP in the same outside-out patches were less than additive (85 +/- 10 % of the predicted sum, P < 0.05). 4. P2X receptors and nicotinic cholinergic receptors (nAChRs) are linked in a mutually inhibitory manner in guinea-pig myenteric neurons. The functional interaction does not involve ligand binding sites, Ca2+-dependent mechanisms, a change in the driving force for Na+ or cytoplasmic signalling mechanisms.
Figures
 ) with 2.5 m
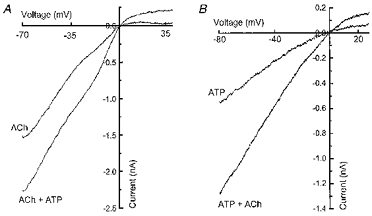
Comment in
-
Cross-talk between apparently independent receptors.J Physiol. 1998 Dec 15;513 ( Pt 3)(Pt 3):629-30. doi: 10.1111/j.1469-7793.1998.629ba.x. J Physiol. 1998. PMID: 9824704 Free PMC article. No abstract available.
References
-
- Bean BP. Pharmacology and electrophysiology of ATP-activated ion channels. Trends in Pharmacological Sciences. 1992;13:87–90. - PubMed
-
- Brake AJ, Wagenbach MJ, Julius D. New structural motif for ligand-gated ion channel defined by an inotropic ATP receptor. Nature. 1994;371:519–523. - PubMed
-
- Chen C-C, Akoplan AN, Sivilotti L, Colquhoun D, Burnstock G, Wood JN. A P2X purinoceptor expressed by a subset of sensory neurons. Nature. 1995;377:428–431. - PubMed
Publication types
MeSH terms
Substances
Grants and funding
LinkOut - more resources
Full Text Sources
Miscellaneous