

Hypsographic demography: the distribution of human population by altitude
- PMID: 9826643
- PMCID: PMC24316
- DOI: 10.1073/pnas.95.24.14009
Hypsographic demography: the distribution of human population by altitude
Abstract
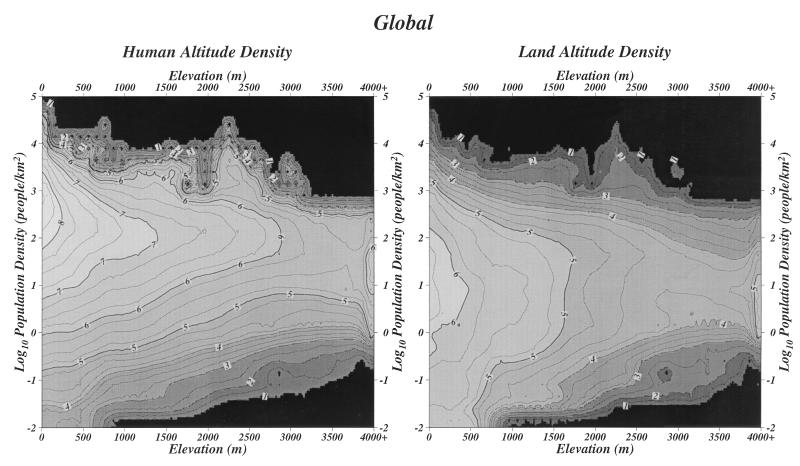
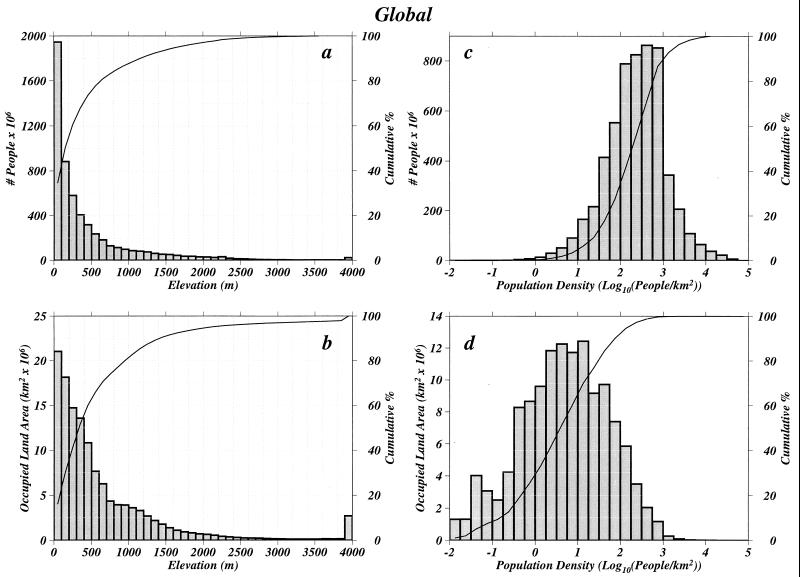
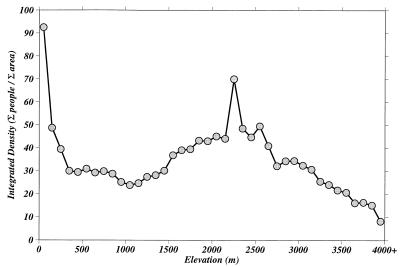
The global distribution of the human population by elevation is quantified here. As of 1994, an estimated 1.88 x 10(9) people, or 33. 5% of the world's population, lived within 100 vertical meters of sea level, but only 15.6% of all inhabited land lies below 100 m elevation. The median person lived at an elevation of 194 m above sea level. Numbers of people decreased faster than exponentially with increasing elevation. The integrated population density (IPD, the number of people divided by the land area) within 100 vertical meters of sea level was significantly larger than that of any other range of elevations and represented far more people. A significant percentage of the low-elevation population lived at moderate population densities rather than at the highest densities of central large cities. Assessments of coastal hazards that focus only on large cities may substantially underestimate the number of people who could be affected.
Figures
References
-
- Baker P T. Science. 1969;163:1149–1156. - PubMed
-
- De Jong G F. Social Biol. 1970;17:114–119. - PubMed
-
- Kopec R J. J Geography. 1971;70:541–550.
-
- United Nations Population Division. World Urbanization Prospects: The 1996 Revision. New York: United Nations; 1997.
-
- Warrick R A, Barrow E M, Wigley T M L, editors. Climate and Sea Level Change: Observations, Projections and Implications. New York: Cambridge Univ. Press; 1993.
Publication types
MeSH terms
LinkOut - more resources
Full Text Sources
Research Materials
