

NMR scalar couplings across Watson-Crick base pair hydrogen bonds in DNA observed by transverse relaxation-optimized spectroscopy
- PMID: 9826668
- PMCID: PMC24341
- DOI: 10.1073/pnas.95.24.14147
NMR scalar couplings across Watson-Crick base pair hydrogen bonds in DNA observed by transverse relaxation-optimized spectroscopy
Abstract
This paper describes the NMR observation of 15N---15N and 1H---15N scalar couplings across the hydrogen bonds in Watson-Crick base pairs in a DNA duplex, hJNN and hJHN. These couplings represent new parameters of interest for both structural studies of DNA and theoretical investigations into the nature of the hydrogen bonds. Two dimensional [15N,1H]-transverse relaxation-optimized spectroscopy (TROSY) with a 15N-labeled 14-mer DNA duplex was used to measure hJNN, which is in the range 6-7 Hz, and the two-dimensional hJNN-correlation-[15N,1H]-TROSY experiment was used to correlate the chemical shifts of pairs of hydrogen bond-related 15N spins and to observe, for the first time, hJHN scalar couplings, with values in the range 2-3.6 Hz. TROSY-based studies of scalar couplings across hydrogen bonds should be applicable for large molecular sizes, including protein-bound nucleic acids.
Figures
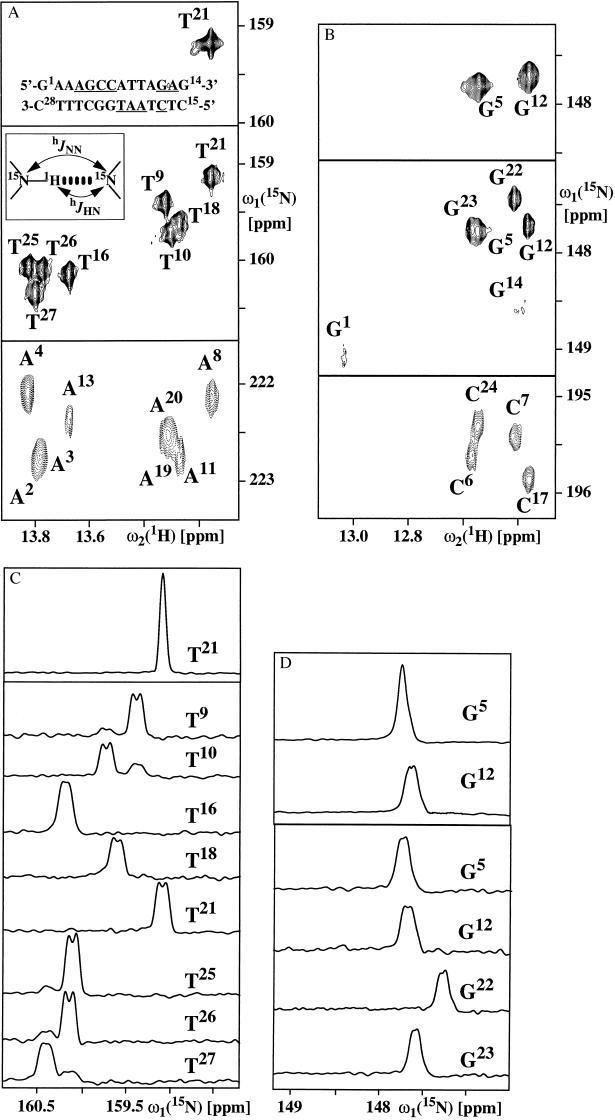
 C base pairs. (C) Cross sections along
ω1(15N) through the individual cross peaks in
the spectra (A). (C
Lower)
Direct correlation cross-peaks in the uniformly
13C,15N-labeled DNA duplex. (C
Upper) Direct correlation cross peaks in the partially
labeled duplex. (D) Same presentation as C
for cross sections along ω1(15N) taken
through the individual cross peaks in the spectra (B).
C base pairs. (C) Cross sections along
ω1(15N) through the individual cross peaks in
the spectra (A). (C
Lower)
Direct correlation cross-peaks in the uniformly
13C,15N-labeled DNA duplex. (C
Upper) Direct correlation cross peaks in the partially
labeled duplex. (D) Same presentation as C
for cross sections along ω1(15N) taken
through the individual cross peaks in the spectra (B).
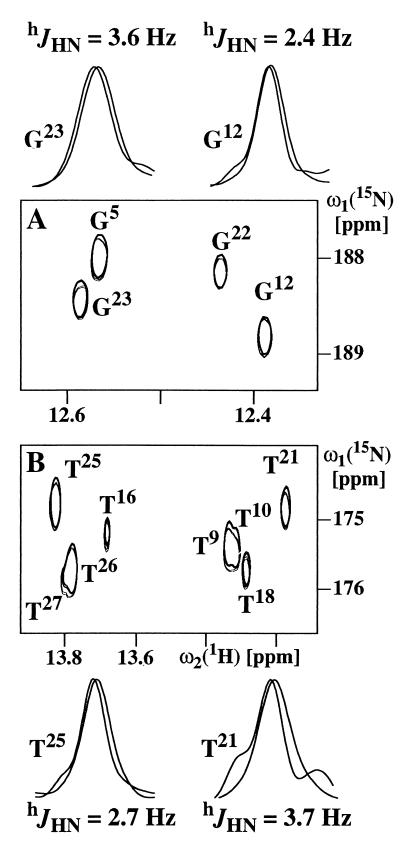 C base pairs and A⩵T base pairs,
respectively. To facilitate comparison, one spectrum was shifted
relative to the other by ≈90 Hz along
ω2(1H), so that corresponding peaks overlap
along this dimension. The relayed cross-peaks from each of the two
spectra are represented by two contour lines. For selected base pairs,
superpositions of cross sections along
ω1(15N) taken through the original, unshifted
peaks are shown above and below the two panels, where the two peaks to
be compared have been normalized to the same intensity. The shift
between the two peaks provides an E.COSY-type representation of
hJHN (see text).
C base pairs and A⩵T base pairs,
respectively. To facilitate comparison, one spectrum was shifted
relative to the other by ≈90 Hz along
ω2(1H), so that corresponding peaks overlap
along this dimension. The relayed cross-peaks from each of the two
spectra are represented by two contour lines. For selected base pairs,
superpositions of cross sections along
ω1(15N) taken through the original, unshifted
peaks are shown above and below the two panels, where the two peaks to
be compared have been normalized to the same intensity. The shift
between the two peaks provides an E.COSY-type representation of
hJHN (see text).References
-
- Jeffrey G A, Saenger W. Hydrogen Bonding in Biological Structures. Berlin: Springer; 1991.
-
- Wüthrich K. NMR of Proteins and Nucleic Acids. New York: Wiley; 1986.
-
- Pervushin K, Riek R, Wider G, Wüthrich K. J Am Chem Soc. 1998;120:6394–6400.
-
- Pervushin K, Wider G, Wüthrich K. J Biomol NMR. 1998;12:345–348. - PubMed
Publication types
MeSH terms
Substances
LinkOut - more resources
Full Text Sources
Miscellaneous
