

Tumor necrosis factor-alpha induces adhesion molecule expression through the sphingosine kinase pathway
- PMID: 9826677
- PMCID: PMC24350
- DOI: 10.1073/pnas.95.24.14196
Tumor necrosis factor-alpha induces adhesion molecule expression through the sphingosine kinase pathway
Abstract
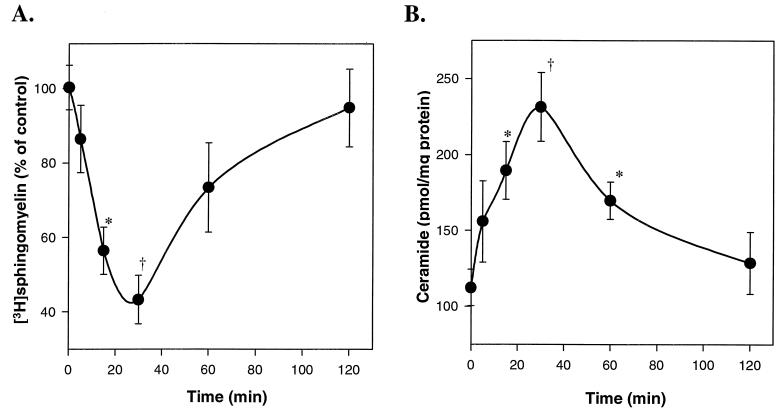
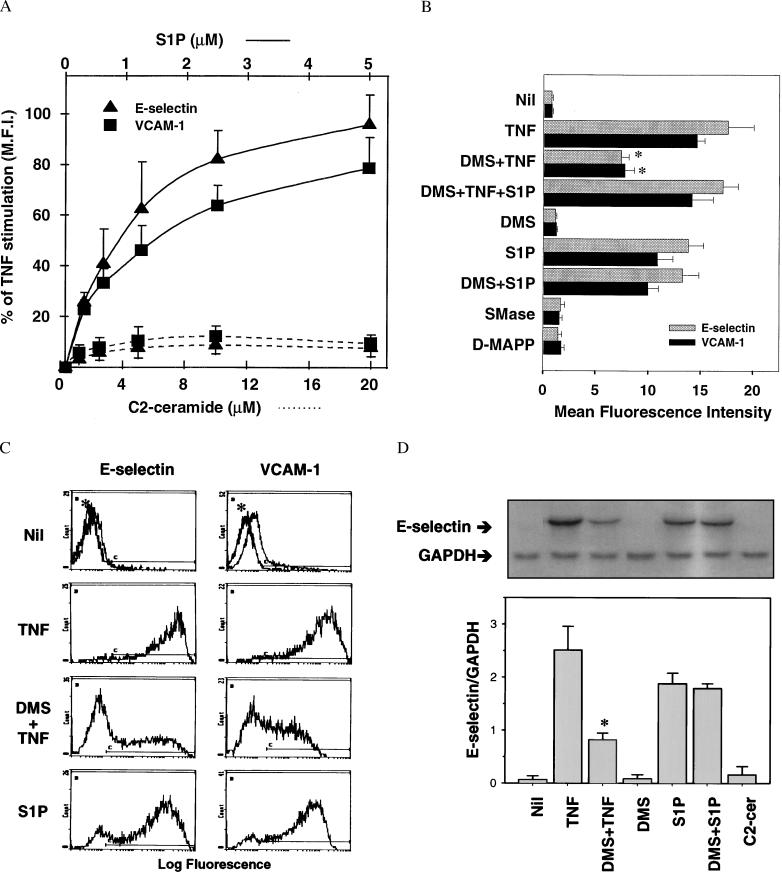
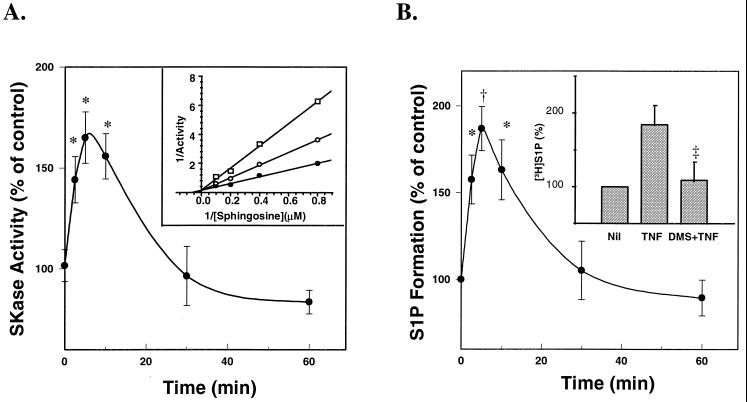
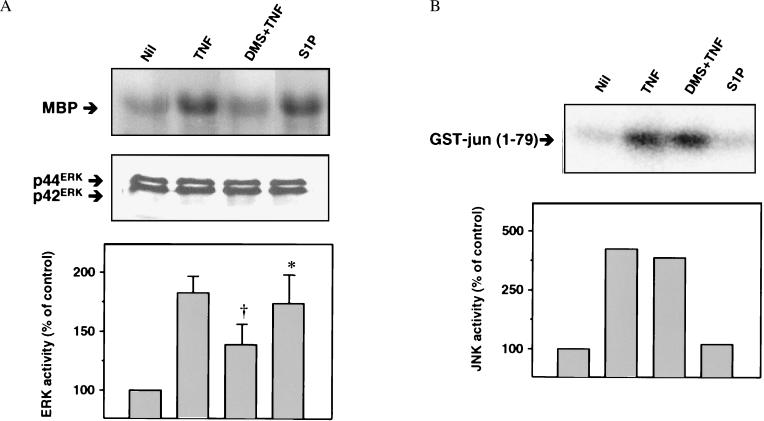
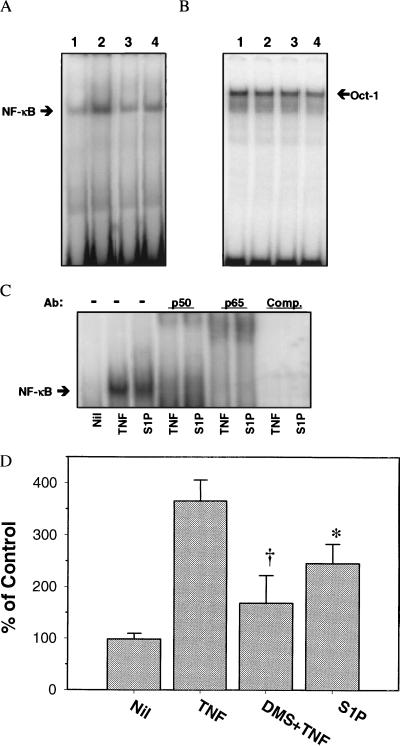
The signaling pathways that couple tumor necrosis factor-alpha (TNFalpha) receptors to functional, especially inflammatory, responses have remained elusive. We report here that TNFalpha induces endothelial cell activation, as measured by the expression of adhesion protein E-selectin and vascular adhesion molecule-1, through the sphingosine kinase (SKase) signaling pathway. Treatment of human umbilical vein endothelial cells with TNFalpha resulted in a rapid SKase activation and sphingosine 1-phosphate (S1P) generation. S1P, but not ceramide or sphingosine, was a potent dose-dependent stimulator of adhesion protein expression. S1P was able to mimic the effect of TNFalpha on endothelial cells leading to extracellular signal-regulated kinases and NF-kappaB activation, whereas ceramide or sphingosine was not. Furthermore, N, N-dimethylsphingosine, an inhibitor of SKase, profoundly inhibited TNFalpha-induced extracellular signal-regulated kinases and NF-kappaB activation and adhesion protein expression. Thus we demonstrate that the SKase pathway through the generation of S1P is critically involved in mediating TNFalpha-induced endothelial cell activation.
Figures
Similar articles
-
Globular adiponectin induces adhesion molecule expression through the sphingosine kinase pathway in vascular endothelial cells.Life Sci. 2007 Aug 23;81(11):939-43. doi: 10.1016/j.lfs.2007.08.002. Epub 2007 Aug 17. Life Sci. 2007. PMID: 17822721
-
High density lipoproteins (HDL) interrupt the sphingosine kinase signaling pathway. A possible mechanism for protection against atherosclerosis by HDL.J Biol Chem. 1999 Nov 12;274(46):33143-7. doi: 10.1074/jbc.274.46.33143. J Biol Chem. 1999. PMID: 10551885
-
Glabridin suppresses intercellular adhesion molecule-1 expression in tumor necrosis factor-alpha-stimulated human umbilical vein endothelial cells by blocking sphingosine kinase pathway: implications of Akt, extracellular signal-regulated kinase, and nuclear factor-kappaB/Rel signaling pathways.Mol Pharmacol. 2006 Mar;69(3):941-9. doi: 10.1124/mol.105.017442. Epub 2005 Dec 14. Mol Pharmacol. 2006. PMID: 16354764
-
Sphingosine-1-phosphate receptor-2 mediated NFκB activation contributes to tumor necrosis factor-α induced VCAM-1 and ICAM-1 expression in endothelial cells.Prostaglandins Other Lipid Mediat. 2013 Oct;106:62-71. doi: 10.1016/j.prostaglandins.2013.06.001. Epub 2013 Jun 11. Prostaglandins Other Lipid Mediat. 2013. PMID: 23770055 Free PMC article.
-
Sphingosine 1-phosphate signalling via the endothelial differentiation gene family of G-protein-coupled receptors.Pharmacol Ther. 2000 Nov;88(2):115-31. doi: 10.1016/s0163-7258(00)00084-x. Pharmacol Ther. 2000. PMID: 11150592 Review.
Cited by
-
Sphingosine-1-phosphate receptor 3 promotes leukocyte rolling by mobilizing endothelial P-selectin.Nat Commun. 2015 Apr 2;6:6416. doi: 10.1038/ncomms7416. Nat Commun. 2015. PMID: 25832730 Free PMC article.
-
The Sphingolipid-Modulating Drug Opaganib Protects against Radiation-Induced Lung Inflammation and Fibrosis: Potential Uses as a Medical Countermeasure and in Cancer Radiotherapy.Int J Mol Sci. 2024 Feb 15;25(4):2322. doi: 10.3390/ijms25042322. Int J Mol Sci. 2024. PMID: 38396999 Free PMC article.
-
Sphingolipid Metabolism and Signaling in Endothelial Cell Functions.Adv Exp Med Biol. 2022;1372:87-117. doi: 10.1007/978-981-19-0394-6_8. Adv Exp Med Biol. 2022. PMID: 35503177 Review.
-
Molecular cloning and characterization of a lipid phosphohydrolase that degrades sphingosine-1- phosphate and induces cell death.Proc Natl Acad Sci U S A. 2000 Jul 5;97(14):7859-64. doi: 10.1073/pnas.120146897. Proc Natl Acad Sci U S A. 2000. PMID: 10859351 Free PMC article.
-
Uncovering the 'sphinx' of sphingosine 1-phosphate signalling: from cellular events to organ morphogenesis.Biol Rev Camb Philos Soc. 2022 Feb;97(1):251-272. doi: 10.1111/brv.12798. Epub 2021 Sep 28. Biol Rev Camb Philos Soc. 2022. PMID: 34585505 Free PMC article. Review.
References
Publication types
MeSH terms
Substances
LinkOut - more resources
Full Text Sources
Other Literature Sources
