. 1998 Nov 24;95(24):14244-9.
doi: 10.1073/pnas.95.24.14244.

Explosive invasion of plant mitochondria by a group I intron

Affiliations

Explosive invasion of plant mitochondria by a group I intron

Y Cho et al. Proc Natl Acad Sci U S A. .

Abstract

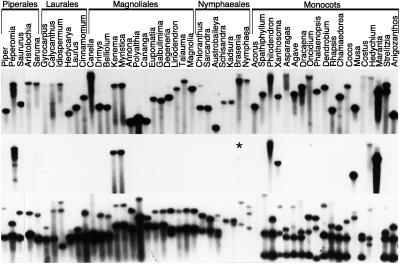
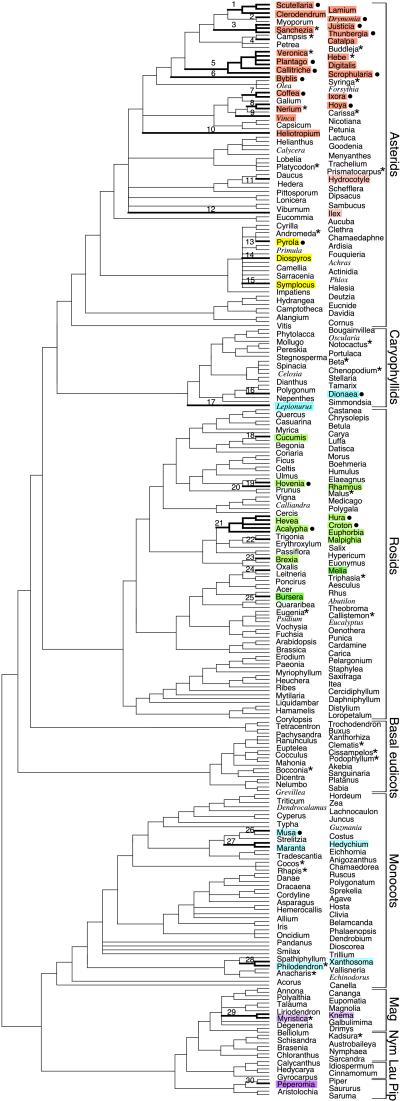
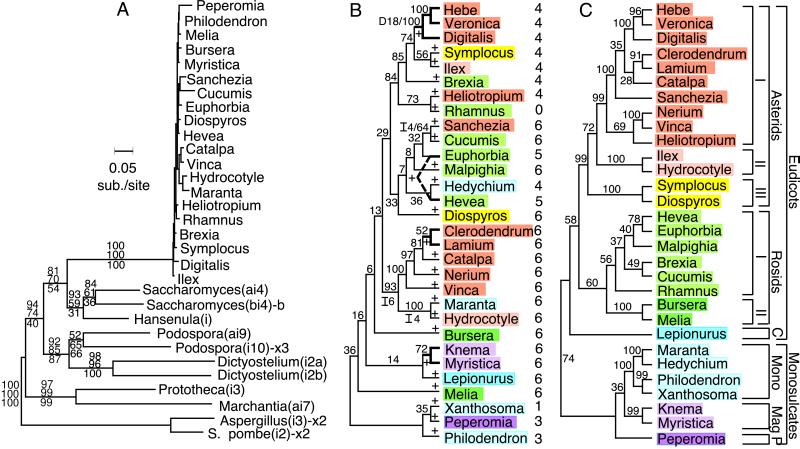
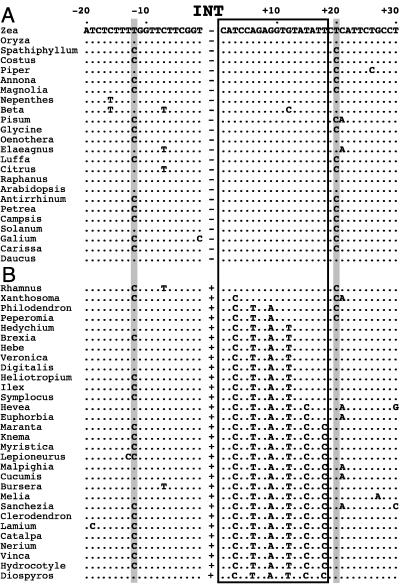
Group I introns are mobile, self-splicing genetic elements found principally in organellar genomes and nuclear rRNA genes. The only group I intron known from mitochondrial genomes of vascular plants is located in the cox1 gene of Peperomia, where it is thought to have been recently acquired by lateral transfer from a fungal donor. Southern-blot surveys of 335 diverse genera of land plants now show that this intron is in fact widespread among angiosperm cox1 genes, but with an exceptionally patchy phylogenetic distribution. Four lines of evidence-the intron's highly disjunct distribution, many incongruencies between intron and organismal phylogenies, and two sources of evidence from exonic coconversion tracts-lead us to conclude that the 48 angiosperm genera found to contain this cox1 intron acquired it by 32 separate horizontal transfer events. Extrapolating to the over 13,500 genera of angiosperms, we estimate that this intron has invaded cox1 genes by cross-species horizontal transfer over 1,000 times during angiosperm evolution. This massive wave of lateral transfers is of entirely recent occurrence, perhaps triggered by some key shift in the intron's invasiveness within angiosperms.


Figures

Figure 1
Figure 1
Southern-blot hybridizations showing presence or absence of two mt introns among 51 of the 341 land plants examined in this study. BamHI-cut DNAs were arranged according to presumptive phylogenetic relationship and hybridized with probes internal to the cox1 coding sequence from Beta vulgaris (Top), the single cox1 group I intron from Veronica ugrestis (Middle), and the single cox2 group II intron from Zea mays (Bottom). ∗ indicates weak, non-cox1 hybridization in Brasenia schreberi (see text).
Figure 2
Figure 2
Sporadic distribution of the cox1 intron among 281 examined species of angiosperms. The cladogram is rooted on gymnosperms and is from a parsimony analysis (Y.-L.Q., unpublished results) of a 1,428-bp region of the chloroplast rbcL gene. The 48 taxa that hybridized strongly to the cox1 intron probe are shaded in color; the colors designate nine major groups of angiosperms (cf. Fig. 3C). Heavy branches mark the 30 monophyletic intron-containing clades (numbered 1–30) under an all-gain/no-loss model of intron evolution. • marks the 18 intron-hybridizing taxa whose cox1 genes were not sequenced (cf. Fig. 3). Names of the 19 taxa for which phylogenetic substitutes were used in the rbcL analyses are italicized (cf. Fig. 3C). ∗ marks the 25 taxa for which rbcL sequences are not available and which were positioned based on other evidence. Mag, Magnoliales; Nym, Nymphaeales; Lau, Laurales; Pip, Piperales.
Figure 3
Figure 3
Phylogenetic history of the cox1 intron. (A) Maximum-likelihood tree of the cox1 and all related introns. Bootstrap values for each node are shown in a column above and below the corresponding branch and are, from top to bottom, from neighbor-joining, parsimony, and likelihood analyses, respectively. Introns located at the same cox1 position as in this study are unmarked; introns at two other positions in cox1 are marked “x2” or “x3”; and an intron in the cob gene is marked with a “b.” (B) Maximum-likelihood tree of 30 angiosperm cox1 introns. Numbers on the tree are bootstrap values. The four synapomorphic intron gaps (which were not used to build this tree) are marked by “I” or “D” (for insertion or deletion relative to the Peperomia intron) followed by the gap’s length in bp. + signs on the tree mark 25 inferred gains of the intron among these 30 taxa. Color-coding is as in Fig. 3C. Numbers at right indicate number of 3′-flanking nucleotides changed by coconversion (see Fig. 4B). Bold branches mark four small clades of introns thought to have originated from the same intron gain event. (C) Organismal tree from a maximum-likelihood analysis of a combined data set of chloroplast rbcL and mt cox1 coding sequences, excluding the coconversion region (see Fig. 4). Numbers are bootstrap values. Color-coding is as described in the text. C, caryophyllids; Mono, monocots; Mag, Magnoliales; P, Piperales.
Figure 4
Figure 4
Coconversion of cox1 exonic sequences immediately 3′ (boxed region) to the intron insertion site (marked “INT”). Dots indicate identity to the Zea reference sequence. Taxa are arranged in phylogenetic order, with the intron-containing angiosperms first grouped according to length of coconversion tract. Shaded columns indicate positions of C-to-U RNA editing (A. Shirk and J.D.P., unpublished results); editing sites are known to evolve rapidly (28). (A) Angiosperms lacking the intron. (B) Angiosperms containing the intron.
Figure 5
Figure 5
Two extreme models for the pathway of cox1 intron transfer in plants and nonplants. (A) An all nonplant-to-plant transfer model. Left cladogram shows six donor organisms, all nonplants (F1–6). Arrows show donor-recipient relationships for six separate intron transfers to plants (P1–10 in Right cladogram). (B) Intron phylogeny based on the transfers diagrammed in A, showing phylogenetic interspersion of donor (F) and recipient (P) sequences. (C) An all-plant-to-plant transfer model. A single initiating transfer from the nonplant F3 lineage to plants is shown, followed by five successive plant-to-plant transfers. (D) Intron phylogeny based on C, showing a clade of 10 plant introns whose phylogeny is incongruent with that of the same plants in C. Branch lengths in these cladograms are not proportional to time.

Comment in

References

    1. Dujon B. Gene. 1989;82:91–114. - PubMed
    1. Lambowitz A M, Belfort M. Annu Rev Biochem. 1993;62:587–622. - PubMed
    1. Belfort M, Perlman P S. J Biol Chem. 1995;270:30237–30240. - PubMed
    1. Delahodde A, Goguel V, Becam A M, Creusot F, Perea J, Banroques J, Jacq C. Cell. 1989;56:431–441. - PubMed
    1. Wenzlau J M, Saldanha R J, Butow R A, Perlman P S. Cell. 1989;56:421–430. - PubMed

Publication types

Substances

Associated data

LinkOut - more resources