Comparative Study
. 1998 Nov 24;95(24):14326-31.
doi: 10.1073/pnas.95.24.14326.

Differential binding to HLA-C of p50-activating and p58-inhibitory natural killer cell receptors

Affiliations
Comparative Study

Differential binding to HLA-C of p50-activating and p58-inhibitory natural killer cell receptors

M Valés-Gómez et al. Proc Natl Acad Sci U S A. .

Abstract

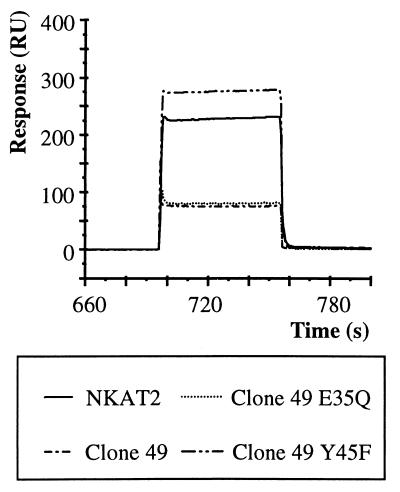
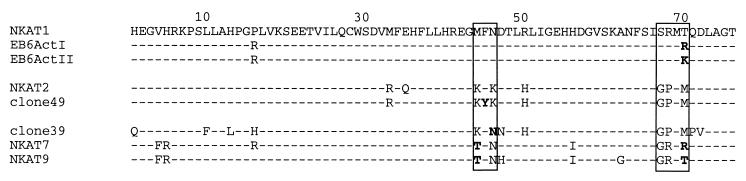
Natural killer (NK) cell cytotoxicity is regulated in large part by the expression of NK cell receptors able to bind class I major histocompatibility complex glycoproteins. The receptors associated with recognition of HLA-C allospecificities are the two-domain Ig-like molecules, p50 and p58 proteins, with highly homologous extracellular domains but differing in that they have either an activating or inhibitory function, respectively, depending on the transmembrane domain and cytoplasmic tails that they possess. We have compared the binding to HLA-Cw7 of an inhibitory p58 molecule, NKAT2, the highly homologous activating p50 molecule, clone 49, and a second activating p50 molecule, clone 39, which has homologies to both NKAT1 and NKAT2. NKAT2 binds to HLA-Cw7 with very rapid association and dissociation rates. However, the p50 receptors bind only very weakly, if at all, to HLA-C. The molecular basis of this difference is analyzed, and the functional significance of these observations is discussed.


Figures

Figure 1
Figure 1
GL183 binds both NKAT2 and clone 49, but not NKAT1. GL183 was injected at a flow rate of 30 μl/min over a control surface and NKAT1 [484 resonance units (RU)], NKAT2 (879 RU), and clone 49 (582 RU) proteins, immobilized on a CM5 chip via amine coupling. This experiment is representative of several repeated by using different chips prepared with multiple batches of refolded proteins.
Figure 2
Figure 2
Clone 49 and clone 39 do not bind HLA-Cw7. (A) Increasing concentrations of HLA-Cw7 (11.4 and 22.7 μM) were injected over control, NKAT1 (148 RU), NKAT2 (437 RU), and clone 49 (631 RU). (B) Increasing concentrations of HLA-Cw7 (5.8 and 11.4 μM) were injected over control, NKAT2 (594 RU), clone 49 (737 RU), and clone 39 (884 RU). (C) Scatchard plots of the data shown in A. These data are representative of multiple experiments.
Figure 3
Figure 3
The mutation of clone 49 at position 45 restores binding to HLA-Cw7. HLA-Cw7 (5.8 μM) was injected over NKAT2 (456 RU), clone 49 (673 RU), and the two mutants of clone 49 Y45F (669 RU) and E35Q (1028 RU). These data are representative of multiple experiments.
Figure 4
Figure 4
Influence of peptide on HLA-Cw7 binding to NKAT2. (A) Increasing concentrations of HLA-Cw7 loaded with peptide RYRPGTVAL were injected over control, NKAT1 (484 RU), NKAT2 (879 RU), and clone 49 (582 RU). (B) Increasing concentrations of HLA-Cw7 loaded with peptide KYFDEHYEY were injected over control, NKAT1, NKAT2, and clone 49. (C) Increasing concentrations of HLA-Cw7 loaded with peptide KYFDEHYLY were injected over control, NKAT1, NKAT2, and clone 49.These data are representative of multiple experiments.
Figure 5
Figure 5
Sequence alignment of a region (residues 1–76) of domain 1 of several p50 and p58 NK receptors. Boxes indicate residues in the putative binding site for HLA-C. Dashes indicate identity with NKAT1.
Figure 6
Figure 6
Comparison of the modeled structures of NKAT2 (A, B, and C), clone 49 (D, E, and F), and clone 39 (G, H, and I) with the coordinates for NKAT1 (34). Using Rasmol (49), the front view, where the cytoplasmic region of the molecule would be at the bottom of the figure (A, C, and E), and the top view, obtained after rotating the front view 50° on a horizontal (x) axis (B, D, and F), are depicted. Dimorphic positions between group 1 and group 2 receptors are colored in green. The residues that differ between clone 49 and NKAT2 are colored yellow. Unique residues present only in clone 39 are colored orange. The potential surfaces, calculated by using grasp (50), of NKAT2, clone 49, and clone 39 are shown in C, F, and I, in the top view.

References

    1. Lazetic S, Chang C, Houchins J P, Lanier L L, Phillips J H. J Immunol. 1996;157:4741–4745. - PubMed
    1. Brooks A G, Posch P E, Scorzelli C J, Borrego F, Coligan J E. J Exp Med. 1997;185:795–800. - PMC - PubMed
    1. Carretero M, Cantoni C, Bellon T, Bottino C, Biassoni R, Rodriguez A, Perez-Villar J J, Moretta L, Moretta A, Lopez-Botet M. Eur J Immunol. 1997;27:563–567. - PubMed
    1. Moretta A, Bottino C, Vitale M, Pende D, Biassoni R, Mingari M C, Moretta L. Annu Rev Immunol. 1996;14:619–648. - PubMed
    1. Borrego F, Ulbrecht M, Weiss E H, Coligan J E, Brooks A G. J Exp Med. 1998;187:813–818. - PMC - PubMed

Publication types

MeSH terms