

Effects of chromosome underreplication on cell division in Escherichia coli
- PMID: 9829948
- PMCID: PMC107724
- DOI: 10.1128/JB.180.23.6364-6374.1998
Effects of chromosome underreplication on cell division in Escherichia coli
Abstract
The key processes of the bacterial cell cycle are controlled and coordinated to match cellular mass growth. We have studied the coordination between replication and cell division by using a temperature-controlled Escherichia coli intR1 strain. In this strain, the initiation time for chromosome replication can be displaced to later (underreplication) or earlier (overreplication) times in the cell cycle. We used underreplication conditions to study the response of cell division to a delayed initiation of replication. The bacteria were grown exponentially at 39 degreesC (normal DNA/mass ratio) and shifted to 38 and 37 degreesC. In the last two cases, new, stable, lower DNA/mass ratios were obtained. The rate of replication elongation was not affected under these conditions. At increasing degrees of underreplication, increasing proportions of the cells became elongated. Cell division took place in the middle in cells of normal size, whereas the longer cells divided at twice that size to produce one daughter cell of normal size and one three times as big. The elongated cells often produced one daughter cell lacking a chromosome; this was always the smallest daughter cells, and it was the size of a normal newborn cell. These results favor a model in which cell division takes place at only distinct cell sizes. Furthermore, the elongated cells had a lower probability of dividing than the cells of normal size, and they often contained more than two nucleoids. This suggests that for cell division to occur, not only must replication and nucleoid partitioning be completed, but also the DNA/mass ratio must be above a certain threshold value. Our data support the ideas that cell division has its own control system and that there is a checkpoint at which cell division may be abolished if previous key cell cycle processes have not run to completion.
Figures

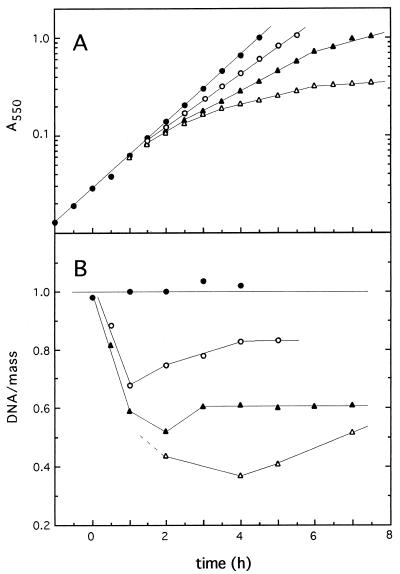
 ), 37°C (▴), or 36°C (▵). The growth in
mass was monitored by measuring absorbance
(A550), and the DNA/mass values were obtained
from flow-cytometric measurements (see Materials and Methods). DNA/mass
ratios are expressed relative to the values obtained at 39°C.
), 37°C (▴), or 36°C (▵). The growth in
mass was monitored by measuring absorbance
(A550), and the DNA/mass values were obtained
from flow-cytometric measurements (see Materials and Methods). DNA/mass
ratios are expressed relative to the values obtained at 39°C.
 ). Notice
that more experimental data are taken into account in panel B than are
shown in panel A.
). Notice
that more experimental data are taken into account in panel B than are
shown in panel A.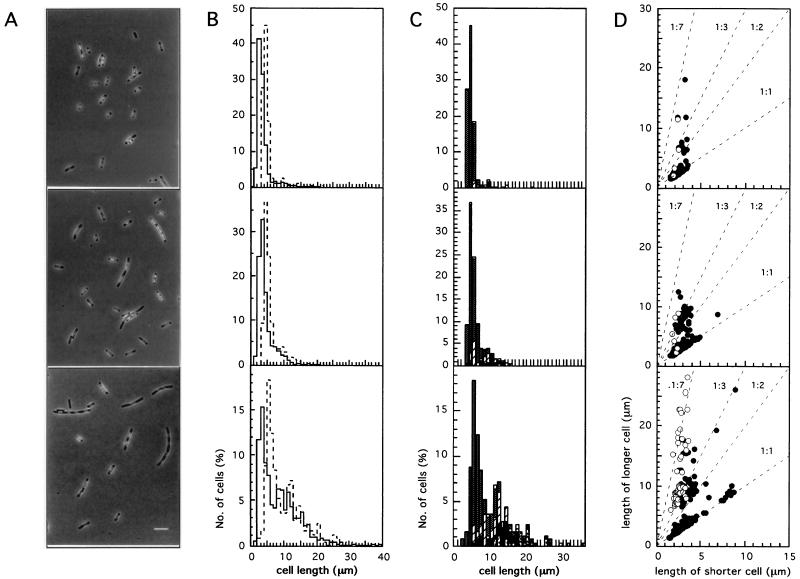
 )
nucleoids. (D) To represent the localization of the septum, the lengths
of the two future daughter cells produced in each septation event were
plotted against each other, with the shorter cell always being chosen
for the x axis. The dotted lines represent different
daughter cell length ratios. Closed circles represent the cells which
would give two nucleated daughter cells after division, and open
circles represent the cells which would give one nucleated and one
nucleoid-free daughter cell. In the latter case, the anucleate cell was
always the shorter one.
)
nucleoids. (D) To represent the localization of the septum, the lengths
of the two future daughter cells produced in each septation event were
plotted against each other, with the shorter cell always being chosen
for the x axis. The dotted lines represent different
daughter cell length ratios. Closed circles represent the cells which
would give two nucleated daughter cells after division, and open
circles represent the cells which would give one nucleated and one
nucleoid-free daughter cell. In the latter case, the anucleate cell was
always the shorter one.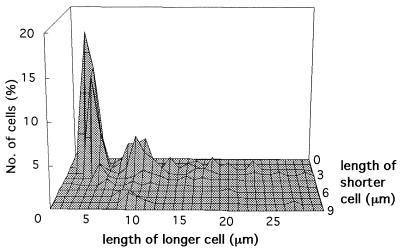
References
-
- Åkerlund T, Nordström K, Bernander R. Branched Escherichia colicells. Mol Microbiol. 1993;10:849–858. - PubMed
-
- Åkerlund T, Bernander R, Nordström K. Cell division in Escherichia coli minBmutants. Mol Microbiol. 1992;6:2073–2083. - PubMed
-
- Bernander R, Nordström K. Chromosome replication does not trigger cell division in E. coli. Cell. 1990;60:365–374. - PubMed
-
- Bernander R, Dasgupta S, Nordström K. The E. colicell cycle and the plasmid R1 replication cycle in the absence of the DnaA protein. Cell. 1991;64:1145–1153. - PubMed
Publication types
MeSH terms
Substances
LinkOut - more resources
Full Text Sources
