. 1999 Jan 1;514 ( Pt 1)(Pt 1):211-27.
doi: 10.1111/j.1469-7793.1999.211af.x.

Regional crypt function in rat large intestine in relation to fluid absorption and growth of the pericryptal sheath

Affiliations

Regional crypt function in rat large intestine in relation to fluid absorption and growth of the pericryptal sheath

R J Naftalin et al. J Physiol. .

Abstract

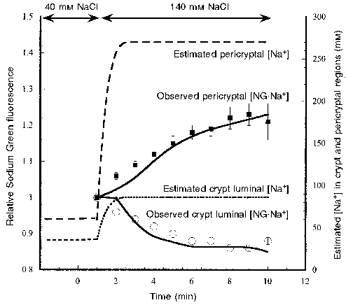
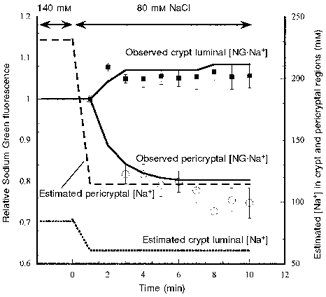
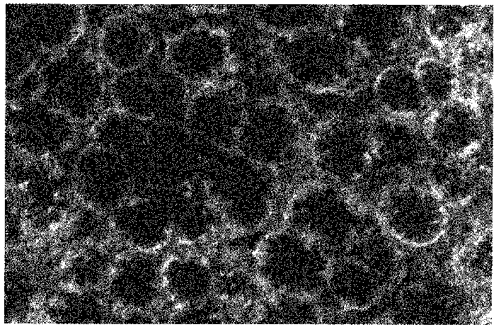
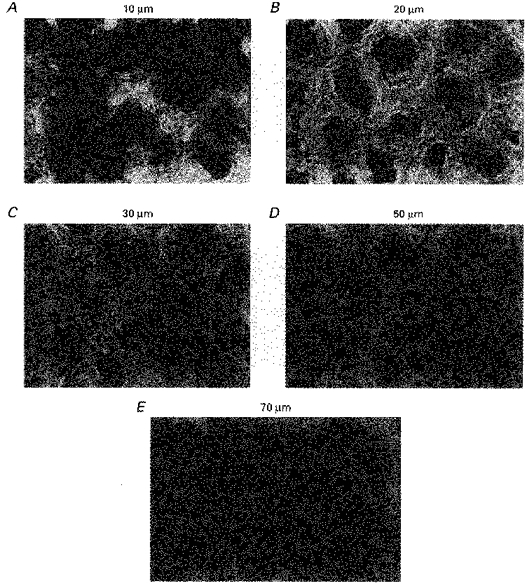
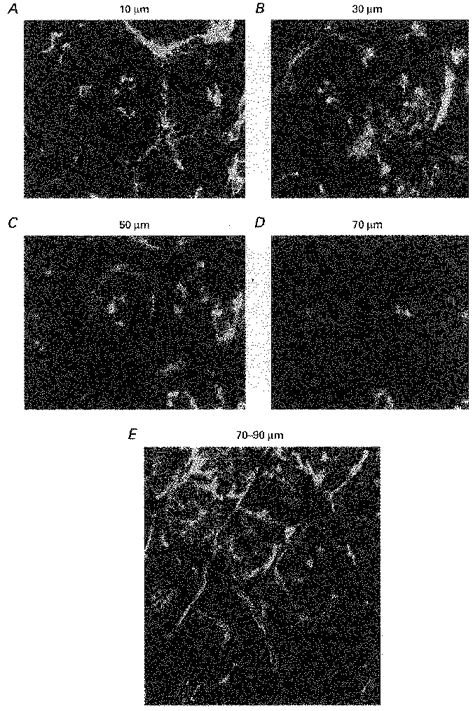
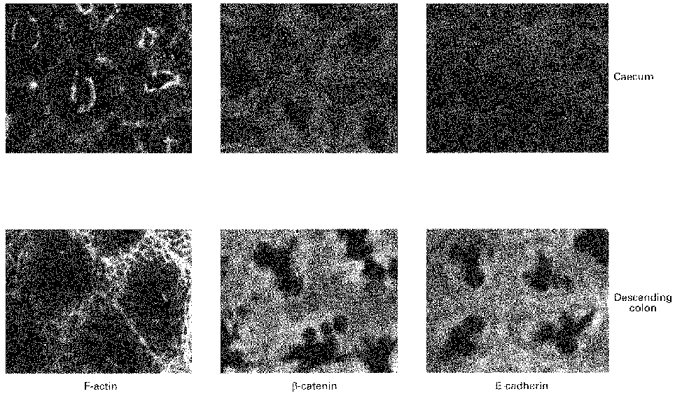
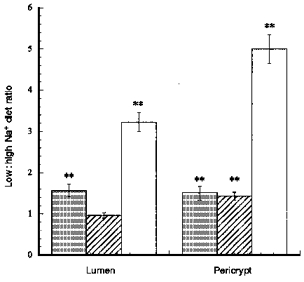
1. Confocal microscopic studies of rat colonic mucosa showed that the pericryptal sheath surrounding distal colonic crypts is an effective barrier both to dextran and NaCl movement, whereas no such structure surrounds the caecal crypts. 2. The distal colonic pericryptal barrier was functionally demonstrated by accumulation of Sodium Green within the pericryptal space. After exposure to benzamil, Sodium Green accumulation was decreased. Fluorescein isocyanate-labelled dextran (FITC dextran; molecular mass 10000 Da) was accumulated in the crypt lumens and pericryptal spaces. Both dextran and Sodium Green accumulation were absent from the pericryptal zone surrounding caecal crypts. 3. Low dietary Na+ intake raised rat plasma aldosterone and stimulated distal pericryptal sheath growth and adhesiveness as shown by increased amounts of F-actin, smooth muscle actin, beta-catenin and E-cadherins in the pericryptal zone. It also raised the capacity of the distal colon to dehydrate against a high luminal hydraulic resistance. This linkage indicates that trophic effects on the colon resulting from a low Na+ diet are not confined solely to effects on transepithelial Na+ transport, but are observed in the pericryptal sheath. 4. A computer model of crypt function confirms that a pericryptal sheath with low permeability to NaCl is an essential component of the crypt dehydrating mechanism.


Figures

Figure 1
Figure 1. An adaptation of the Curran & McIntosh double membrane model
Diagrams showing how the Curran & McIntosh (1962) double membrane model is adapted to describe crypt-induced faecal dehydration.
Figure 2
Figure 2. The effects of raising extracellular [Na+] from 40 to 140 mM on the Sodium Green fluorescence signal in the pericryptal region
The pericryptal space (high fluorescence signal; see also Figs 12–13) and crypt luminal regions (low fluorescence signal) as measured by serial confocal microscopic images at a depth of 20 μm below the tissue surface over a 10 min period. Alteration in Na+ concentration is by substitution of choline chloride for NaCl (low fluorescence signal). Each signal is normalized to the initial fluorescence after changing solutions. The images are analysed using the NIH image program (Wayne Rasband (wayne@helix.nih.gov), National Institutes of Health, USA). The signal ratio is also shown. The error bars are ±s.e.m. (n= 5–8). The lines following the points (▪, pericryptal fluorescence; ^, crypt luminal fluorescence) are simulations of the Sodium Green fluorescence data using a simple model of the pericryptal space and crypt lumen (Fig. 1B). The predicted changes in pericryptal and crypt luminal Na+ are also shown.
Figure 3
Figure 3. The effects of decreasing extracellular [Na+] from 140 to 80 mM on Sodium Green fluorescence in the pericryptal region
Experimental details are as described in the legend to Fig. 2. The observed pericryptal and crypt luminal fluorescence changes shown are normalized to the signals obtained immediately after making the Na+ concentration change as for Fig. 2. The lines following the points (^, pericryptal fluorescence; ▪, crypt luminal fluorescence) are simulations of the Sodium Green fluorescence data using a simple model of the pericryptal space and crypt lumen (Fig. 1B). The predicted changes in pericryptal and crypt luminal Na+ are also shown.
Figure 12
Figure 12. Pericryptal Na+ accumulation demonstrated by difference imaging
A, high power confocal fluorescence views of descending colonic crypts perfused for 5 min with Sodium Green dye at a depth of 20–40 μm from the mucosal surface. B-D, the difference images between 5 and 10 min (B), between 5 and 15 min (C) and between 5 and 20 min (D). The difference images in B-D are obtained by subtracting the fluorescence densities of superimposable images obtained at 5 min intervals using the image subtraction facility in the NIH image program. The increase in fluorescence surrounding the crypts is seen as a narrow line, which increases in intensity between 5 and 20 min. The black parts of the difference image show no change in fluorescence intensity. Width of each panel, 165 μm.
Figure 13
Figure 13
Confocal image of Sodium Green accumulation in the pericryptal region of rat caecal crypts Note absence of dye accumulation in the caecal pericryptal spaces. Width of panel, 500 μm.
Figure 4
Figure 4. Confocal microscopic depth scan through descending colonic mucosa stained with BODIPY-phalloidin for F-actin
Staining of F-actin with BODIPY-phalloidin in rat descending colonic mucosa at varying depths: A, 10 μm; B, 20 μm; C, 30 μm; D, 50 μm; E, 70 μm. Width of panels, 120 μm. The F-actin in the fibronexus is the fluorescent material adjacent to the surfaces in the upper parts of the crypts. At a depth of 70 μm F-actin is a narrow, filamentous pericryptal layer. F-actin is also present in the crypt lumen due microfilaments within the crypt luminal brush-border.
Figure 5
Figure 5. Confocal microscopic depth scan through caecal mucosa stained with BODIPY-phalloidin showing F-actin distribution in crypt cells (A-D) and pericryptal capillaries (E)
F-actin is less apparent in caecal crypts than descending colon The highest proportion of F-actin is in the outer 10 μm of the caecal crypts. Width of panels in A-D, 225 μm. Width of panels in E, 250 μm.
Figure 6
Figure 6. The relative amounts of F-actin in descending colonic (▪) and caecal (^) crypts plotted as radial distributions
The radial densities of F-actin are obtained by measuring the relative fluorescence density in twenty concentric annuli surrounding the centre of each crypt lumen (n= 20 crypts). These are obtained using a macro, which automatically generates the radial density functions (Pedley et al. 1993). The average radial length of the descending colonic and caecal crypts is approximately 40 μm. The low density in the centre of the crypt is due to the absence of F-actin in the lumen. The crest of high density 8–12 μm from the axis of the descending colonic crypts is due to F-actin present in the brush border.
Figure 7
Figure 7. Comparison of distributions of F-actin, E-cadherin and β-catenin in rat descending colonic and caecal crypts
Similar densities of E-cadherin and β-catenin are observed in the crypt luminal cells of both caecum and descending colon. However, the pericryptal region of caecum shows much less staining than that of the descending colon for either protein.
Figure 8
Figure 8. The differences in distribution of F-actin (▪), β-catenin () and E-cadherin (□) between descending colonic crypts and caecal crypts
Each column shows mean values from tissue from 3 rats. Four regions of interest in the crypt and pericryptal regions from each tissue were evaluated. **P < 0.01, descending colon vs. caecum; ***P < 0.001 descending colon vs. caecum; Student's two-tailed t test.
Figure 9
Figure 9
F-actin, E-cadherin and β-catenin distribution in descending colonic mucosa of rats fed on high or low Na+ diets.
Figure 11
Figure 11
Comparison of F-actin (▪), E-cadherin (formula image
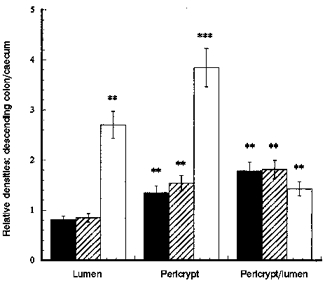
) and β-catenin (□) distribution in descending colonic crypts of rat fed on high and low Na+ diets Each column shows mean values from tissues from 3 rats each fed comtemporaneously on high or low Na+ diets. Four regions of interest in the crypt and pericryptal regions from each tissue were evaluated. **P < 0.01 low Na+vs. high Na+ diet; Student's two-tailed t test.
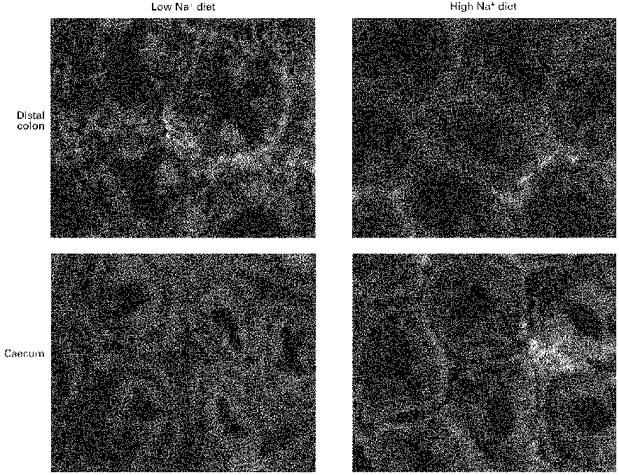
Figure 10
Figure 10. Comparison of α-smooth muscle actin distribution in descending colon and caecum of rats fed low and high Na+ diets
α-Smooth muscle actin is more evident in the pericryptal cells surrounding descending colon of rats fed a low Na+ diet than those fed a high Na+ diet. The figure shows crypts at a depth of between 10 and 20 μm below the tissue surface.
Figure 16
Figure 16. The responses of the models of distal colonic (A, C and E) and caecal (B, D and F) crypts to the effects of raising the luminal hydraulic resistance at 250 s
A and B show that the model response to increased luminal resistance is to increase absorbate tonicity and increase the rate of fluid absorption in line with observed findings (see preceding paper: Naftalin et al. 1999). The model with a low pericryptal sheath resistance (B) becomes unstable after 400 s as crypt luminal water and Na+ fall to zero. However, with this model no large increase in absorbate tonicity is observed after increasing the load hydraulic resistance (F). The crypt luminal and pericryptal space hydrostatic pressures are shown in C and D. In the distal colonic crypt model (C) the luminal tension falls to very low levels (-5000 cmH2O) as this can be sustained by the large osmotic pressure across the crypt wall. The luminal pressure developed in the model of caecal crypts is lower (D). The [NaCl] concentrations in the pericryptal space and crypt lumens are shown in E and F. In the descending colonic crypt model (E) a high osmolarity is present at steady state in the pericryptal space and a low osmolarity is present in the crypt lumen. No large osmotic pressure differences are sustained in the caecal model (F). It can be noted that the effect of raising the crypt luminal tension is to decrease the pericryptal [NaCl].
Figure 14
Figure 14. The effect of benzamil on Sodium Green fluorescence in the pericryptal region of rat descending colonic crypts
A, the pericryptal Sodium Green fluorescence at an image depth 20–30 μm below the mucosal surface, immediately before addition of benzamil (20 μm) to the perfusion solution. B, difference image as in Fig. 12B is shown, illustrating the regions where the Sodium Green fluorescence signal has decreased in the time between 0.5 and 30 min after addition of benzamil. A decrease in intensity is shown as black; no change is white. Width of each panel, 250 μm.
Figure 15
Figure 15
Variation in the coefficients of the models of crypts from rats fed high and low Na+ diets A and B, effects of increased hydraulic load on the hydraulic conductivities of the crypt lumen, paracellular, transcellular and pericryptal sheath high-resistance (A) and low-resistance (B) pathways. C and D, changes in crypt lumen, paracellular and pericryptal Na+ permeability with high (C) and low (D) pericryptal sheath resistance. The coefficients, which vary, are responding to crypt luminal pressure, which shuts down the paracellular shunt conductances of Na+ and water leaving the transcellular routes unaffected. Thus paracellular, crypt lumen (distal part of crypt lumen) and crypt opening (proximal half of crypt lumen) Lp values show a dramatic decrease when the hydraulic resistance of the colonic lumen is raised at 250 s. The transcellular and pericryptal Lp and pericryptal Na+ permeability remain unaltered.

References

    1. Abayasekara DRE, Onyezili NI, Whitehouse BJ, Laird SM, Vinson GP. Effects of chronic corticotrophin treatment on aldosterone metabolism in the rat. Journal of Endocrinology. 1993;137:445–455. - PubMed
    1. Araki K, Furuya Y, Kobayashi M, Matsuura K, Ogata T, Isozaki H. Comparison of mucosal microvasculature between the proximal and distal human colon. Journal of Electron Microscopy. 1996;45:202–206. - PubMed
    1. Berschneider HM, Powell DW. Fibroblasts modulate intestinal secretory responses to inflammatory mediators. Journal of Clinical Investigation. 1992;89:484–489. - PMC - PubMed
    1. Bleakman D, Naftalin RJ. Hypertonic fluid absorption from rat descending colon in vitro. American Journal of Physiology. 1990;258:G377–390. - PubMed
    1. Bridges RJ, Cragoe EJ, Jr, Frizzell RA, Benos DJ. Inhibition of colonic Na+ transport by amiloride analogues. American Journal of Physiology. 1989;256:C67–74. - PubMed

MeSH terms

LinkOut - more resources