. 1998 Nov 30;143(5):1295-304.
doi: 10.1083/jcb.143.5.1295.

AnkyrinG is required for clustering of voltage-gated Na channels at axon initial segments and for normal action potential firing

Affiliations

AnkyrinG is required for clustering of voltage-gated Na channels at axon initial segments and for normal action potential firing

D Zhou et al. J Cell Biol. .

Abstract

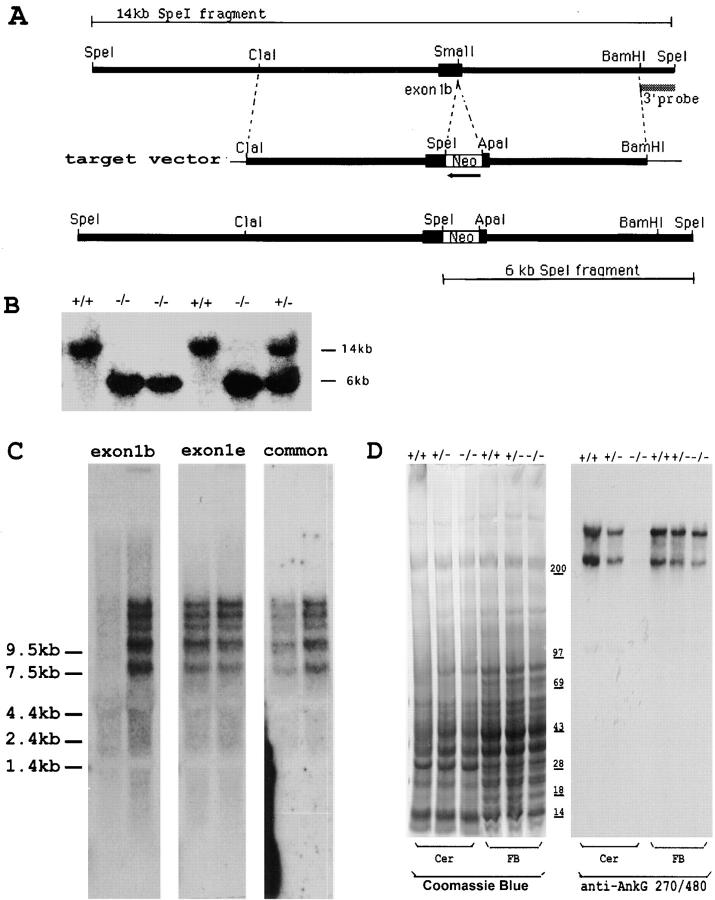
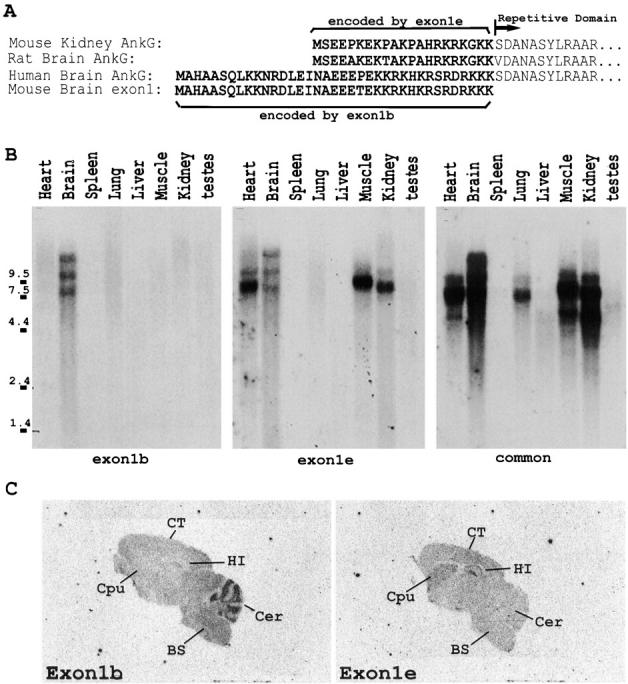
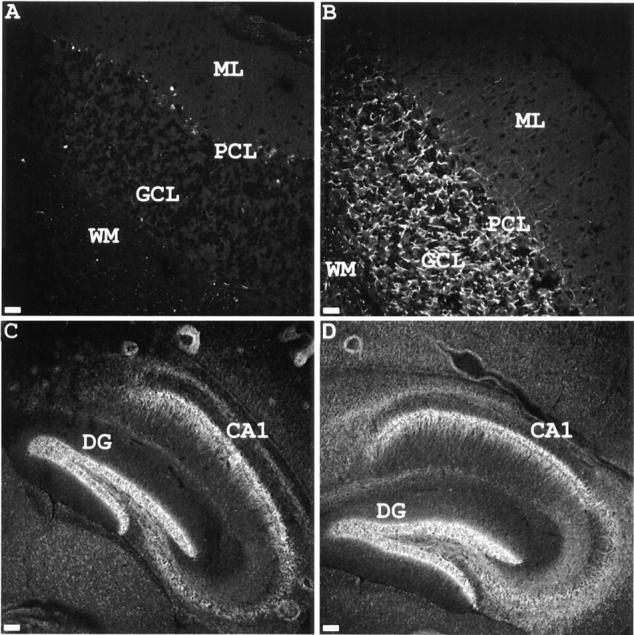
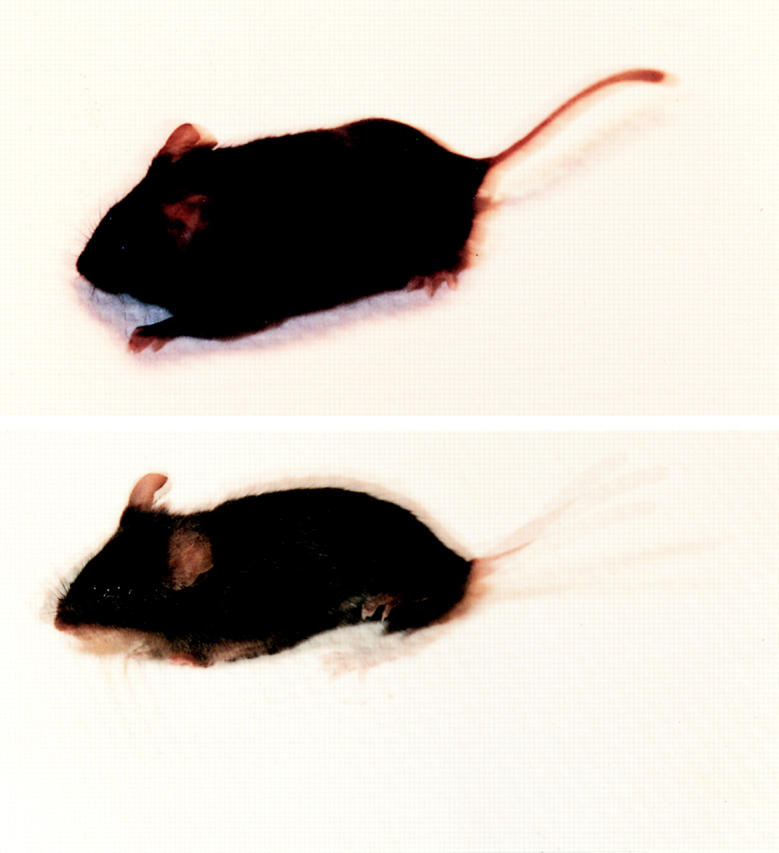
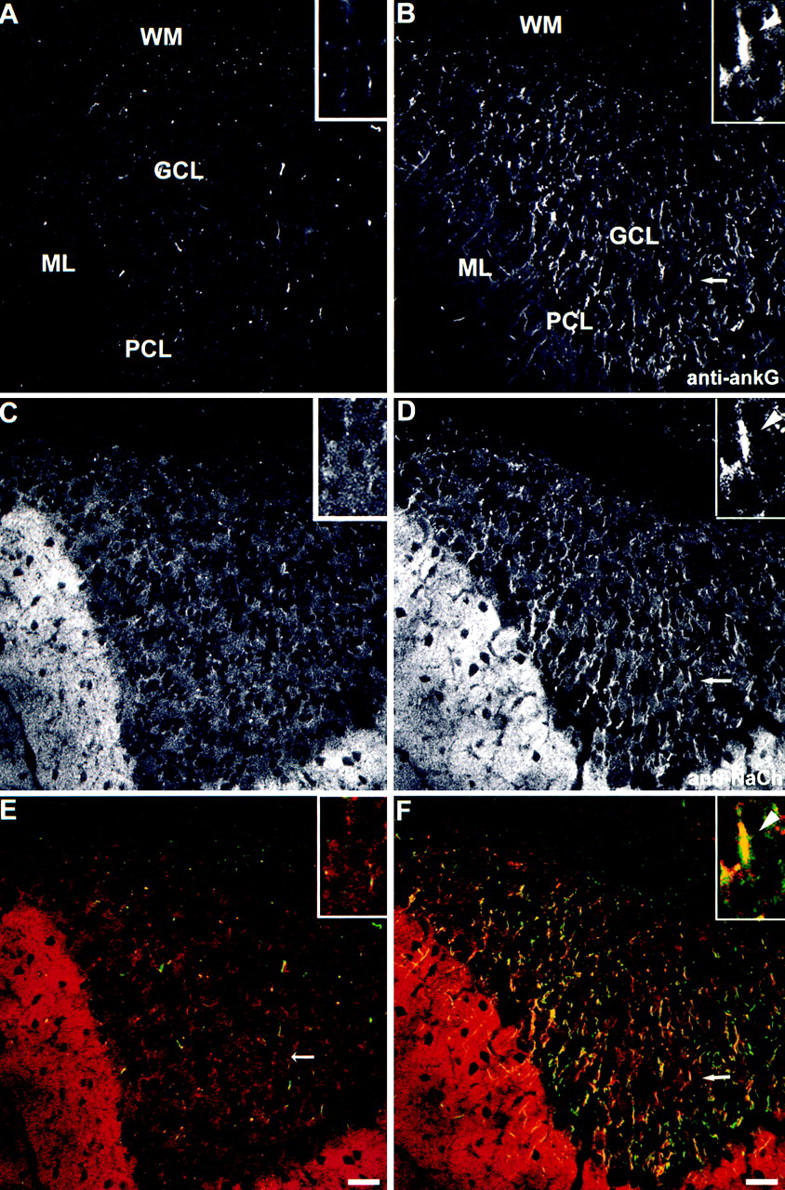
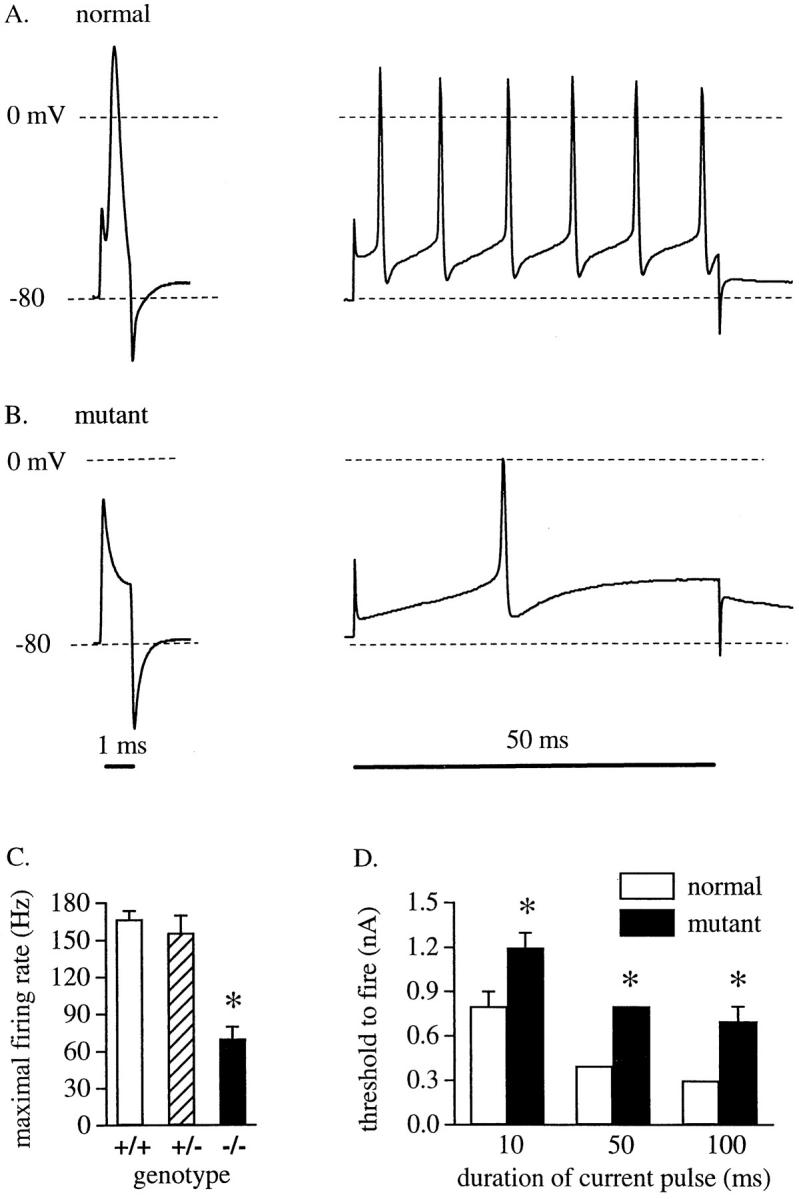
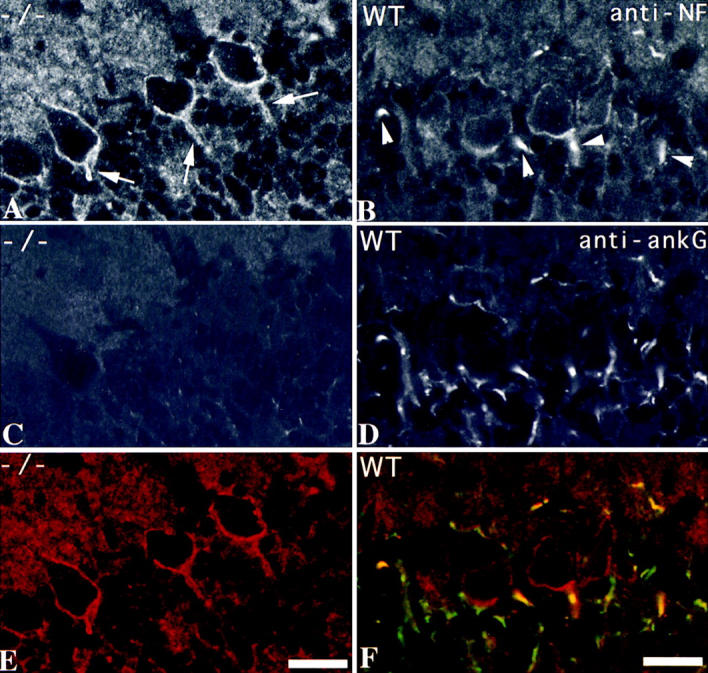
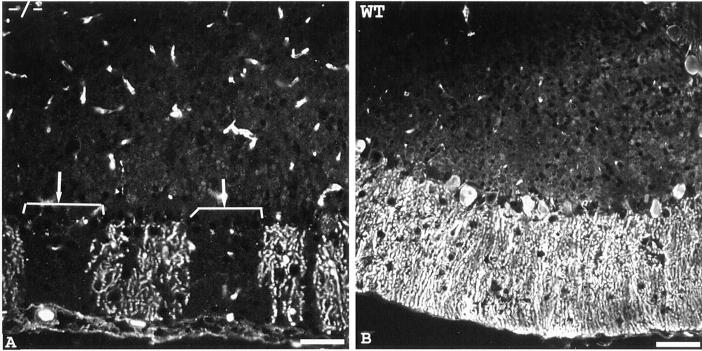
Voltage-gated sodium channels (NaCh) are colocalized with isoforms of the membrane-skeletal protein ankyrinG at axon initial segments, nodes of Ranvier, and postsynaptic folds of the mammalian neuromuscular junction. The role of ankyrinG in directing NaCh localization to axon initial segments was evaluated by region-specific knockout of ankyrinG in the mouse cerebellum. Mutant mice exhibited a progressive ataxia beginning around postnatal day P16 and subsequent loss of Purkinje neurons. In mutant mouse cerebella, NaCh were absent from axon initial segments of granule cell neurons, and Purkinje cells showed deficiencies in their ability to initiate action potentials and support rapid, repetitive firing. Neurofascin, a member of the L1CAM family of ankyrin-binding cell adhesion molecules, also exhibited impaired localization to initial segments of Purkinje cell neurons. These results demonstrate that ankyrinG is essential for clustering NaCh and neurofascin at axon initial segments and is required for physiological levels of sodium channel activity.


Figures

Figure 2
Figure 2
Generation of exon1b-specific ankyrinG knockout mouse by targeted recombination. (A) The restriction map of the ankyrinG genomic sequence covering exon1b, the target vector, and the expected mutant gene. (B) Southern blot analysis of genomic DNA identified mice corresponding to all three expected genotypes. The SpeI-digested DNA were hybridized with the BamHI-SpeI probe as indicated in A. The 14-kb band corresponds to the wild-type allele, while the 6-kb band corresponds to the mutant allele. (C) Northern blot analysis revealed the specific knockout of exon1b-containing transcripts in the homozygous (−/−) mutant mouse. The blot containing RNA isolated from homozygous (left lane) and wild-type (right lane) mouse brain was sequentially hybridized with probe to exon1b, exon1e, and the probe to the common region. The blot was stripped to remove the previous signal after each hybridization. The result indicated that the exon1b-containing ankyrinG transcripts were specifically knocked-out. The 15-kb band seen in Fig. 1 was further separated into three bands in this blot because the gel was run longer and the glyoxal/DMSO method was used. (D) Western blot analysis demonstrated the region-specific knockout of ankyrinG in exon1b-specific knockout mouse. The cerebellum and frontal brain homogenate from wild-type (+/+), heterozygous (+/−), and the homozygous mutant (−/−) was run on a 3.5–17% gradient gel and stained with Coomassie blue dye (left) to monitor the amount of loading. A duplicate gel was transferred to nitrocellulose membrane and probed with antibodies to the tail region of the ankyrinG, which detected the 480- and 270-kD isoforms (right). The results indicate a dramatic reduction of ankyrinG expression in cerebellum. The residual ankyrinG seen in cerebellum of mutant mice was from the axons in the white matter that originated from the other parts of brain or spinal cord.
Figure 1
Figure 1
Expression of two classes of ankyrinG transcripts in mouse brain. (A) Mouse brain contains two different NH2-terminal amino acid sequences of ankyrinG. The predicted NH2-terminal amino acid sequences of ankyrinG from mouse kidney and rat and human brain cDNAs were aligned and compared. The amino acid sequence translated from the coding region of exon1 of ankyrinG genomic DNA was also included. (B) Northern blot analysis revealed that mouse brain contained two classes of ankyrinG transcripts that differed in the first exon. Isoform-specific probes to the brain-specific 5′UTR (exon1b) and the kidney isoform 5′UTR (exon1e) were PCR-amplified from mouse ankyrinG genomic DNA containing the first exon and from ankyrinG cDNA isolated from rat brain, respectively. The results indicated that exon1b-containing transcripts were only found in brain, while exon1e-containing transcripts were found in many tissues. (C) Tissue-specific expression of exon1b and exon1e in P20 mouse brain revealed by in situ hybridization. In situ hybridization with 33P-labeled oligonucleotides unique to exon1b (left) or exon1e (right) indicated that ankyrinG transcripts in frontal cortex (CT), hippocampus (HI), and caudate putamen (Cpu) contained exon1e, while exon1b shows the strongest signal detected in the cellular layers of the cerebellum (Cer). The signals were completely abolished when the sections were preincubated with 100-fold molar excess of the unlabeled probes (data not shown).
Figure 3
Figure 3
Regional loss of ankyrinG in exon1b knockout mouse. Cerebellar (A and B) and hippocampal (C and D) sections of exon1b knockout mouse (A and C) and control littermate (B and D) were stained with chicken antibodies to ankyrinG, followed by FITC-conjugated mouse anti–chicken secondary antibodies. The results indicated that ankyrinG is still expressed in hippocampus of the exon1b knockout mouse, while the expression in cerebellum is drastically reduced. DG, dentate gyrus; CA1, CA1 field of hippocampus; WM, white matter; GCL, granule cell layer; PCL, Purkinje cell layer; ML, molecular cell layer. Bars: (A and B) 20 μm; (C and D) 80 μm.
Figure 4
Figure 4
Photograph of the exon1b-ankyrinG knockout mouse and the control wild-type littermate. The moving wild-type littermate mouse (top) and the mutant mouse (bottom) were pulsed-flashed four times within 1/8 s, during which period of time the shutter of the camera was kept open. Their moving postures were captured and superimposed into one frame. The images demonstrate the tremor behavior of the mutant mouse.
Figure 5
Figure 5
Loss of sodium channel clustering at initial segments of cerebellar granule cell axons of mutant mice. Cerebellar brain sections from mutant mouse (A, C, and E) and the wild-type control littermate (B, D, and F) were double-stained with antibodies to ankyrinG (A and B, green in E and F) and sodium channel (C and D, red in E and F). One typical example of colocalization of ankyrinG and NaCh at the initial segments of granule cells in wild-type mouse cerebellum (B, D, and F, arrows) was magnified and shown in the inset. The initial segment was marked with an arrowhead. Bars, 20 μm.
Figure 6
Figure 6
Deficits in action potential initiation and firing in mutant mice. Whole-cell current clamp recordings of Purkinje cells in cerebellar slices from (A) a normal mouse or (B) a mutant mouse with cerebellar knockout of ankyrinG. Cells were hyperpolarized to −80 mV and the membrane potential responses to 1-ms (left) or 50-ms (right) current injections at the soma were recorded. Dashed lines indicate −80 and 0 mV, as marked. (C) Comparison of the maximal action potential firing rate for 50– 100-ms current injections delivered to Purkinje cells from wild-type (+/+; n = 3), heterozygous (+/−; n = 7), and mutant (−/−; n = 7) mice. A series of depolarizing current injections from 0.1– 1.9 nA in 0.1-nA increments was delivered until the maximal firing rate was reached. (D) Comparison of the minimum current injection required to elicit the first action potential in Purkinje cells from normal (n = 10) and mutant (−/−; n = 7) mice for stimuli of 10, 50, or 100 ms duration. The normal group includes both wild-type and heterozygous mice since the physiological and behavioral phenotypes of the two groups were not different. Data (means ± SEM) were analyzed by a two-tailed t test. *P < 0.001.
Figure 7
Figure 7
Redistribution of neurofascin in Purkinje cells of mutant mice. Sections of cerebellum from P40 mutant mouse (−/−; A, C, and E) and the wild-type control littermate (WT; B, D, and F) were stained with antibodies to ankyrinG (C and D, green in E and F) and neurofascin (A and B, red in E and F). Without ankyrinG, neurofascin was distributed uniformly at the plasma membrane of Purkinje cells (A, arrows). In normal mice, neurofascin was highly concentrated at the initial segments of Purkinje cells (B, arrowheads). Bar, 20 μm.
Figure 8
Figure 8
Neurodegeneration of Purkinje cells in mutant mice. Sections of cerebellum from a 5-mo-old mutant mouse (A) and the wild-type control littermate (B) were stained with antibodies to calbindin. The results show a dramatic reduction of Purkinje cells in the adult mutant mice. Bars, 50 μm.

References

    1. Armstrong CM, Hille B .Voltage-gated ion channels and electrical excitability. Neuron. 1998;20:371–380. - PubMed
    1. Bennett V, Lambert S, Davis JQ, Zhang X. Molecular architecture of the specialized axonal membrane at the node of Ranvier. Soc Gen Physiol Ser. 1997;52:107–120. - PubMed
    1. Boakes RJ, Candy JM, Dick DJ, Harris JB, Pollard S, Thompson J. Abnormal electrophysiological and anatomical characteristics of cerebellar Purkinje cells in the mutant mouse jolting. J Physiol (Lond) 1984;346:27P. - PubMed
    1. Burgess DL, Kohrman DC, Galt J, Plummer NW, Jones JM, Spear B, Meisler MH. Mutation of a new sodium channel gene, Scn8a, in the mouse mutant “motor endplate disease.” . Nat Genet. 1995;10:461–465. - PubMed
    1. Catterall WA. Localization of sodium channels in cultured neural cells. J Neurosci. 1981;1:777–783. - PMC - PubMed

Publication types

MeSH terms

Associated data