Comparative Study
. 1998 Dec;112(6):665-78.
doi: 10.1085/jgp.112.6.665.

Single-channel properties of IKs potassium channels

Affiliations
Comparative Study

Single-channel properties of IKs potassium channels

Y Yang et al. J Gen Physiol. 1998 Dec.

Erratum in

  • J Gen Physiol 1999 Mar;113(3):505

Abstract

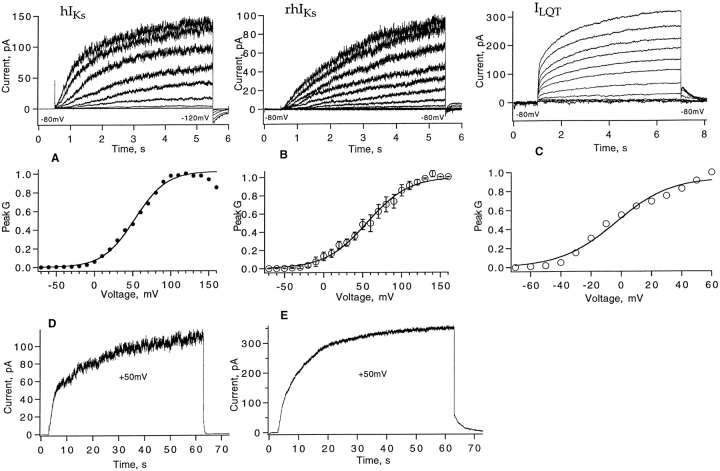
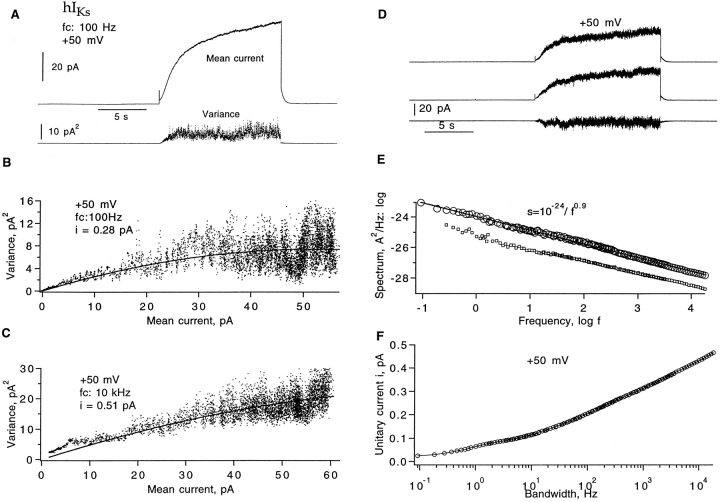
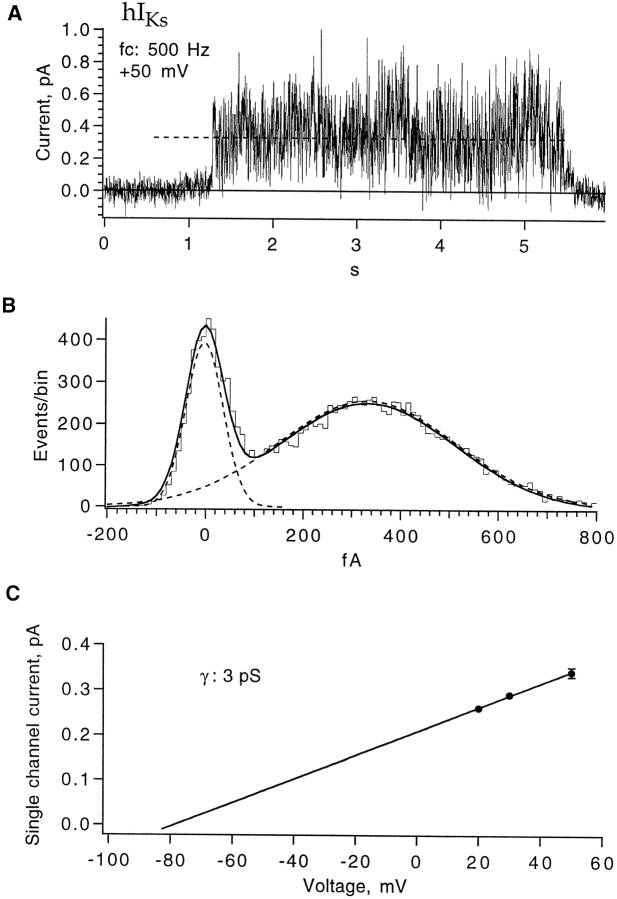
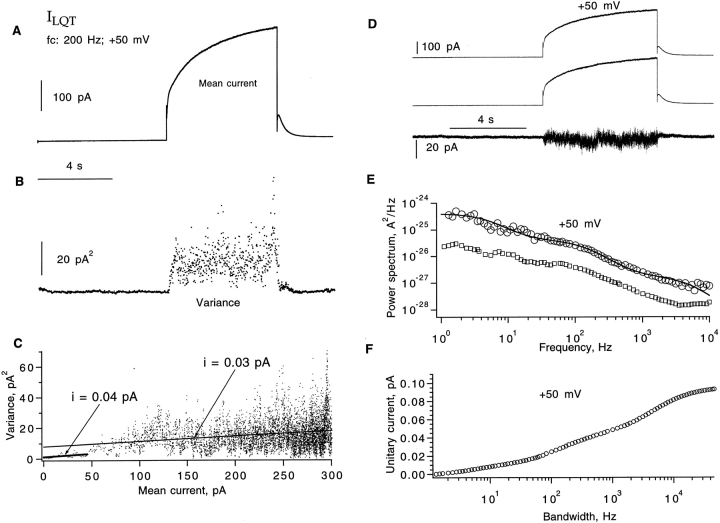
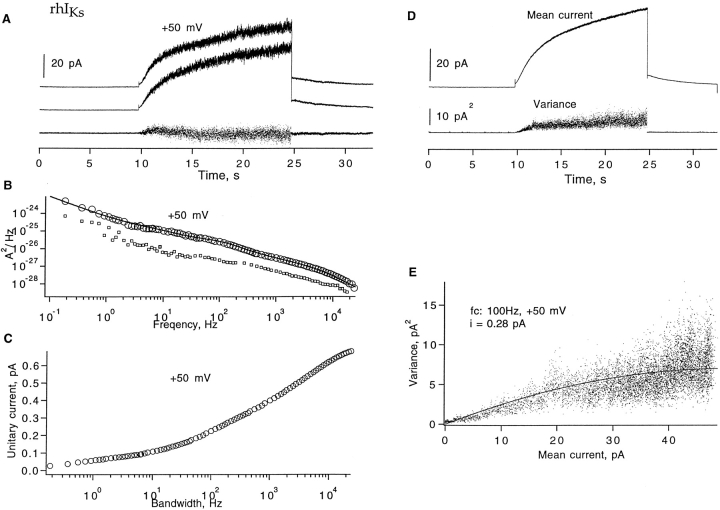
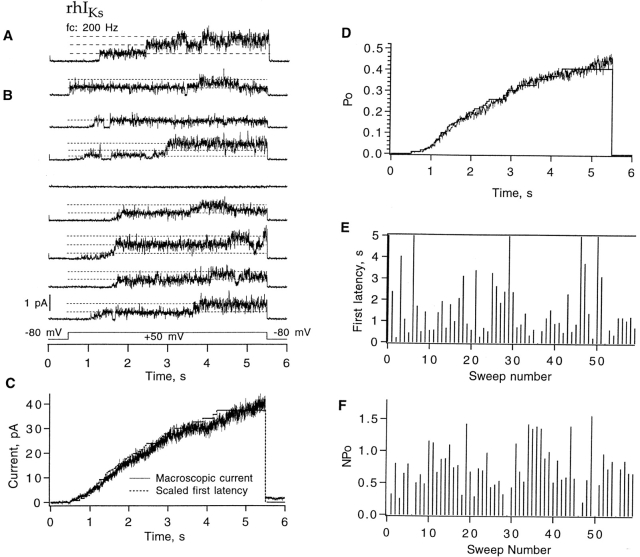
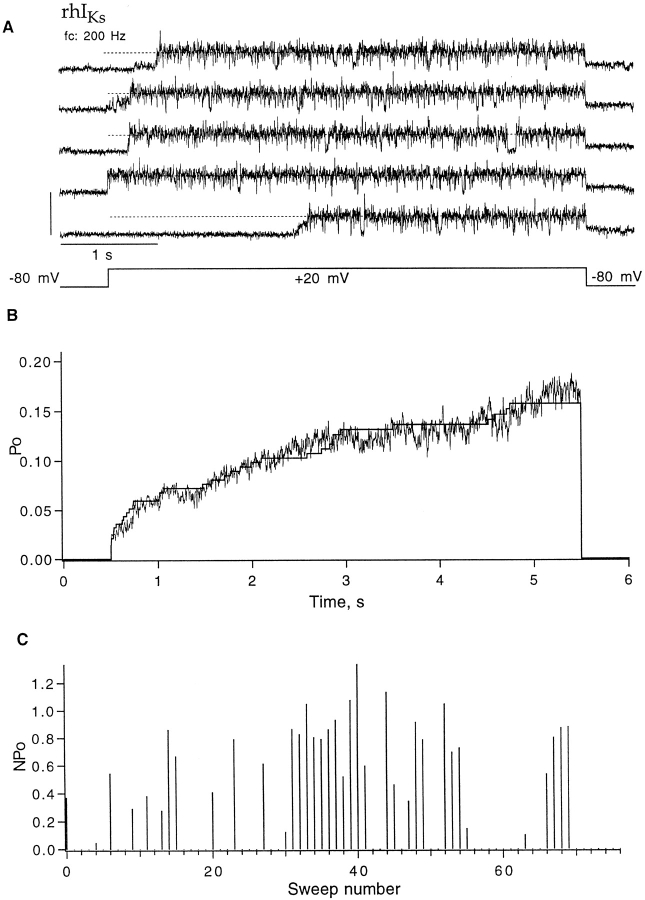
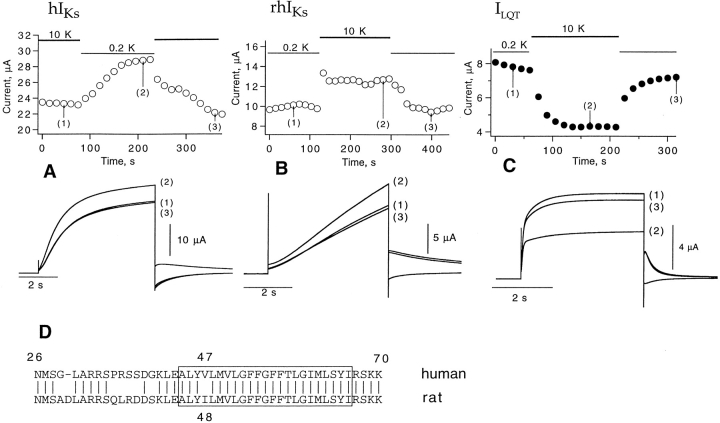
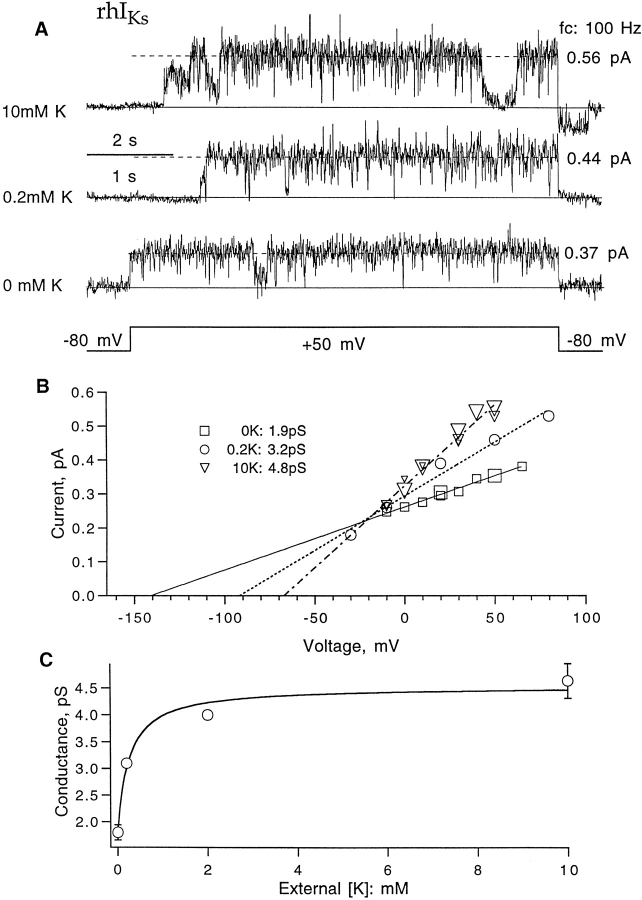
Expressed in Xenopus oocytes, KvLQT1 channel subunits yield a small, rapidly activating, voltage- dependent potassium conductance. When coexpressed with the minK gene product, a slowly activating and much larger potassium current results. Using fluctuation analysis and single-channel recordings, we have studied the currents formed by human KvLQT1 subunits alone and in conjunction with human or rat minK subunits. With low external K+, the single-channel conductances of these three channel types are estimated to be 0.7, 4.5, and 6.5 pS, respectively, based on noise analysis at 20 kHz bandwidth of currents at +50 mV. Power spectra computed over the range 0.1 Hz-20 kHz show a weak frequency dependence, consistent with current interruptions occurring on a broad range of time scales. The broad spectrum causes the apparent single-channel current value to depend on the bandwidth of the recording, and is mirrored in very "flickery" single-channel events of the channels from coexpressed KvLQT1 and human minK subunits. The increase in macroscopic current due to the presence of the minK subunit is accounted for by the increased apparent single-channel conductance it confers on the expressed channels. The rat minK subunit also confers the property that the outward single-channel current is increased by external potassium ions.


Figures

Figure 1
Figure 1
Macroscopic currents from the channel types hIKs (from human minK coexpressed with hKvLQT1), rhIKs (rat minK coexpressed with hKvLQT1), and ILQT (hKvLQT1 expressed alone). (A) Activation of human IKs currents from a cell-attached patch recording with standard patch solutions. Currents (top) were induced by depolarizations to −70 to +110 mV in 20-mV steps from a −80-mV holding potential. No leak subtraction, filtered at 500 Hz. The isochronal voltage dependence of normalized conductance (bottom) was fitted with a Boltzmann function G = G max/(1 + exp[(V1/2 − V)/k], with V1/2 = 52 mV and k = 20 mV. (B) Activation of rhIKs currents from an inside-out patch recording with 130 mM K-aspartate, 10 mM KCl, 1 mM EGTA, pH 7.4 in the bath; 100 mM NaCl, 0.2 mM KCl, 1 mM MgCl2, 1.8 mM CaCl2, pH 7.4 in the pipette. Current activation (top) at −70 to +150 mV in 20-mV steps from −80-mV holding potential. Leak current was subtracted by the P/5 protocol with −100-mV leak holding potential; data were filtered at 500 Hz. The isochronal voltage dependence of rhIKs from three patches is fitted by a Boltzmann function with V1/2 = 56 mV and k = 26 mV. (C) Activation of ILQT from a giant patch (30-μm diameter pipette tip) with 93 mM K-aspartate, 7 mM KCl, 1 mM EGTA, pH 7.4 in the bath, 96 mM NaCl, 2 mM KCl, 1 mM MgCl2, 0.1 mM CaCl2, pH 7.4 in the pipette. Currents were induced by depolarizing pulses from a −80-mV holding potential to potentials of −70 to +60 mV in 10-mV steps, and repolarization to −60 mV; filtered at 100 Hz. No leak current correction was applied. Normalized peak conductance was fitted with V1/2 = −6 mV and k = 18 mV. Conductance in all three cases was computed assuming a linear open-channel current–voltage relationship with a reversal potential of −80 mV. (D) hIKs current from a cell-attached patch recording with standard solutions, showing the response to a 60-s depolarization to +50 mV. Filter bandwidth 40 Hz. (E) A corresponding recording of rhIKs current.
Figure 2
Figure 2
Fluctuation analysis of hIKs currents. (A) Mean current and time-dependent variance computed from 30 sweeps filtered at 100 Hz. The current was induced by +50-mV depolarizing pulses from a −80 mV holding potential in a cell-attached patch recording. Pulses were delivered every 32 s. (B) Mean–variance plot of 100 Hz–filtered currents. A fit of Eq. 1 yields unitary current i v = 0.28 pA and number of channels (n) = 368; the corresponding apparent open probability P max = 0.43. (C) Mean–variance plot from a total of 20 sweeps at 10 kHz bandwidth from the same patch. In this case, 12-s depolarizations to +50 mV were delivered every 32 s. The fit yields i v = 0.51 and P max = 0.24. (D) A pair of successive current traces and their difference filtered at 1 kHz; same set of data as in A. (E) The top trace is the resulting power spectrum of currents from 30 sweeps after correction for background noise. The contribution S shot from ion transport during channels opening was estimated according to S shot = 2e 0 I = 1.4 · 10−29 A2/Hz and was subtracted. The solid line indicates a power-law fit S(f) = 10−24/f      0.9 A2/Hz. The mean current was 45 pA, and the unitary current estimate i s = 0.47 pA at 20 kHz bandwidth. The lower trace shows the spectrum (values plotted one decade lower in the graph for clarity) computed from another representative data set, where the mean current was 39 pA; the unitary current i s = 0.44 pA at 20 kHz. (F) Dependence of apparent unitary current i s (Eq. 3) on filter cut-off frequency at +50 mV. Variance was calculated from the numeric integral of the power spectrum over the frequency range 0.1 Hz–10 kHz.
Figure 3
Figure 3
Frequency distribution of hIKs patch currents. Current was measured at the end of a 5-s depolarization to +50 mV in each of 128 patches, and histograms were constructed. The inset shows an expanded histogram, where the bin at zero represents the 43 patches that showed no IKs current.
Figure 4
Figure 4
Single-channel hIKs current. (A) One sweep showing a putative hIKs single-channel opening, recorded from a three-channel patch at +50 mV. Data were filtered at 500 Hz. (B) All-points amplitude histogram, which yields an apparent unitary current 0.34 pA (indicated by the dashed line in A). (C) Single channel currents estimated from amplitude histograms at 200 Hz bandwidth (n = 4 for +50 mV, n = 1 for other voltages). A linear fit yields 3 pS for the single-channel conductance.
Figure 5
Figure 5
Fluctuation analysis of ILQT. (A) Ensemble mean current was calculated from pairs of sweeps from a total of 10 sweeps, obtained in a giant cell-attached patch recording from an oocyte injected with KvLQT1 RNA alone. Currents were induced by depolarizing pulses to +50 mV from a −80-mV holding potential and repolarized to −60 mV. Data were filtered at 200 Hz. (B) Time course of variance. (C) Variance–mean plot. A linear fit for the current range <50 pA yields unitary current i v = 0.04 pA; i v = 0.03 pA from a linear fit to the entire current range. (D) A pair of aligned current traces and the subtracted current trace filtered at 1 kHz. Same data as in A. (E) Power spectrum calculated from subtracted currents after background noise subtraction. Solid curve is the sum of three Lorentzians with corner frequencies 5, 141, and 5,000 Hz and amplitudes 3.6 · 10−25, 3.7 · 10−26 and 1.6 · 10−27 A2/Hz, respectively. The corresponding mean current was 240 pA, and the estimated single-channel current i s = 0.09 pA at 20 kHz. The bottom trace is the spectrum from another recording, displaced downward by one decade for clarity. The mean current in this case was 370 pA and i s(20 kHz) = 0.08 pA. (F) Unitary current i s was calculated from the integral of the power spectrum; points beyond 10 kHz were computed from the fitted function. In the patch recording, the bath solution was 93 mM K-aspartate, 7 mM KCl, 1 mM EGTA, 10 HEPES, pH 7.4; the pipette solution contained 100 mM NaCl, 1 mM MgCl2, 0.1 mM CaCl2, 5 mM HEPES.
Figure 6
Figure 6
Fluctuation analysis of rhIKs currents. (A) A pair of successive current traces, filtered at 1 kHz. The current was induced by +50-mV depolarizing pulses from −80-mV holding potential, and repolarized to –60 mV in a cell-attached patch recording with 140 mM K-aspartate, 1 mM EGTA, 10 mM HEPES, pH 7.4 in the bath; 96 mM NaCl, 2 mM KCl, 1 mM MgCl2, 0.1 mM CaCl2, 5 mM HEPES in the pipette. Pulses were delivered every 33 s; mean current during the depolarizing pulse was 34 pA. (B) The corrected power spectrum of currents, computed from 36 traces. The solid curve is a fitted power-law function plus four Lorentzian components, of the form S = 1.1 · 10−29 + 6.1 · 10−25/f     1.2 + 6 · 10−26/[1 + (f/11)2] + 2.9 · 10−27/[1 + (f/141)2] + 2.2 · 10−27/[1 + (f/1,195)2] + 8.8 · 10−28/[1 + (f/3,535)2], where f is in Hz and S is in A2/Hz. The unitary current i s = 0.67 pA at 20 kHz bandwidth. The lower trace is the spectrum from another recording in which the mean current was 7 pA and i s = 0.51 pA at 20 kHz. (C) Frequency dependence of unitary current calculated from the numeric integral of power spectrum over the frequency range 0.1 Hz–20 kHz. (D) Ensemble mean current and variance, from the same data filtered at 100 Hz. The variance trace was calculated from pairs of sweeps to minimize error due to drift. (E) Mean–variance plot. Superimposed is a parabolic fit, which yields the unitary current estimate i v = 0.28 pA.
Figure 7
Figure 7
A three-channel, inside-out patch recording from rhIKs channels. (A) A trace with three channels opening during +50-mV depolarization. (B) Eight successive sweeps from the same patch, showing long first latencies in response to depolarizations to +50 mV from the −80-mV holding potential. Pulses were delivered every 8 s. Data were filtered at 200 Hz. (C) Comparison of the time course of the rhIKs macroscopic current seen in another patch (noisy trace) and the first latency function at +50 mV. (D) The ensemble mean time courses of open probability at 50 mV obtained from 60 sweeps. The open probability at the end of the 5-s depolarization was ∼0.5. The superimposed step-wise curve is the first-latency distribution F 1 scaled by the factor 0.8. It was computed according to formula image where F 3 is the observed first-latency distribution from 60 sweeps recorded from the three-channel patch. (E) Diary plot of the three-channel first latency F 3 in the patch recording. Latency values of 5 s correspond to the case in which no channel opens. (F) Diary plot of the time-averaged open probability from this patch. For this recording, the bath solution was 130 mM K-aspartate, 10 mM KCl, 1 mM EGTA, 10 mM HEPES, pH 7.4; the pipette solution was 100 mM NaCl, 0.2 mM KCl, 1 mM MgCl2, 1.8 mM CaCl2, 5 mM HEPES, pH 7.4.
Figure 8
Figure 8
Behavior of rhIKs channels at 20 mV; same three-channel patch as in Fig. 7. (A) Five successive sweeps showing activity from only one channel. (B) The ensemble mean time course obtained from 77 sweeps (noisy trace) shows an instantaneous onset followed by a slow activation phase. The maximum open probability was 0.17. Superimposed is the corrected one-channel first latency F 1 scaled by 0.8. (C) Diary plot of nP o. Currents were elicited by depolarizations to +20 mV, 5-s duration, delivered at 8-s intervals from a holding potential of −80 mV. Of a total 77 sweeps, 37 showed some activity; 11 of those showed a second channel opening during depolarization, and one sweep showed three channels open simultaneously.
Figure 9
Figure 9
Effect of extracellular potassium on peak current of hIKs, rhIKs, and ILQT in the two-electrode voltage clamp. (A) Magnitude of hIKs current at the end of 5-s depolarizations to +30 mV as the bath solution was switched between 0.2 and 10 mM K+. The lower panel shows current traces corresponding to the times indicated at top. (B) rhIKs current; (C) ILQT current; (D) the amino acid sequences of human and rat minK in the vicinity of the putative transmembrane region (box).
Figure 10
Figure 10
Single-channel conductance of rIKs channels with different external K+ solutions. (A) Representative current traces induced by +50-mV depolarizing pulses from −80-mV holding potential. Data were filtered at 100 Hz. (B) Single-channel current as a function of voltage obtained from double-Gaussian fits to amplitude histograms of traces. Fitted lines have slopes of 1.9, 3.2, and 4.8 pS for 0, 0.2, and 10 mM external K+, respectively. (C) External potassium dependence of single channel conductance. Error bars represent SEM (n = 2 for 0 mM and n = 4 for 10 mM; the points at 0.2 and 2 mM K+ are single observations). The superimposed fit is the function γ = 1.8 + 2.8/(1 + 0.5 mM/[K]) pS.

Similar articles

Cited by

References

    1. Aldrich RW, Corey DP, Stevens CF. A reinterpretation of mammalian sodium channel gating based on single channel recording. Nature. 1983;306:436–441. - PubMed
    1. Attali B, Guillemare E, Lesage F, Honore E, Romey G, Lazdunski M, Barhanin J. The protein IsK is a dual activator of K+ and Cl−channels. Nature. 1993;365:850–852. - PubMed
    1. Barhanin J, Lesage F, Guillemare E, Fink M, Lazdunski M, Romey G. K(V)LQT1 and lsK (minK) proteins associate to form the I(Ks) cardiac potassium current. Nature. 1996;384:78–80. - PubMed
    1. Ben-Efraim I, Shai Y, Attali B. Cytoplasmic and extracellular IsK peptides activate endogenous K+ and Cl− channels in Xenopusoocytes. Evidence for regulatory function. J Biol Chem. 1996;271:8768–8771. - PubMed
    1. Blumenthal EM, Kaczmarek LK. The minK potassium channel exists in functional and nonfunctional forms when expressed in the plasma membrane of Xenopusoocytes. J Neurosci. 1994;14:3097–3105. - PMC - PubMed

Publication types

MeSH terms