. 1998 Dec;112(6):715-26.
doi: 10.1085/jgp.112.6.715.

Extracellular zinc ion inhibits ClC-0 chloride channels by facilitating slow gating

Affiliations

Extracellular zinc ion inhibits ClC-0 chloride channels by facilitating slow gating

T Y Chen. J Gen Physiol. 1998 Dec.

Abstract

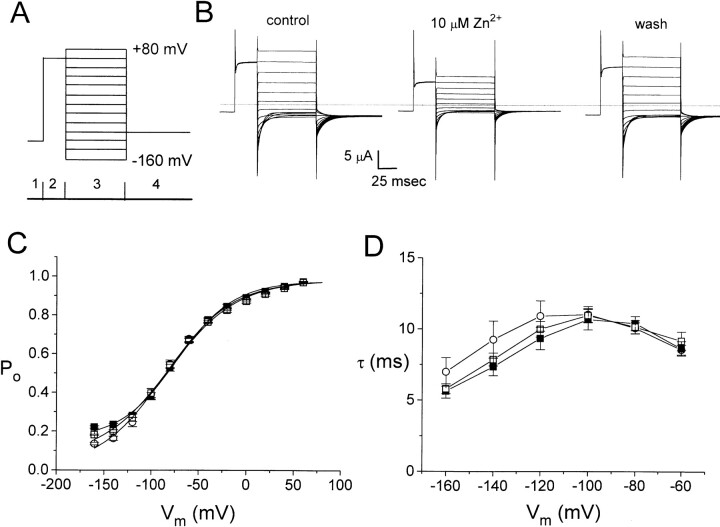
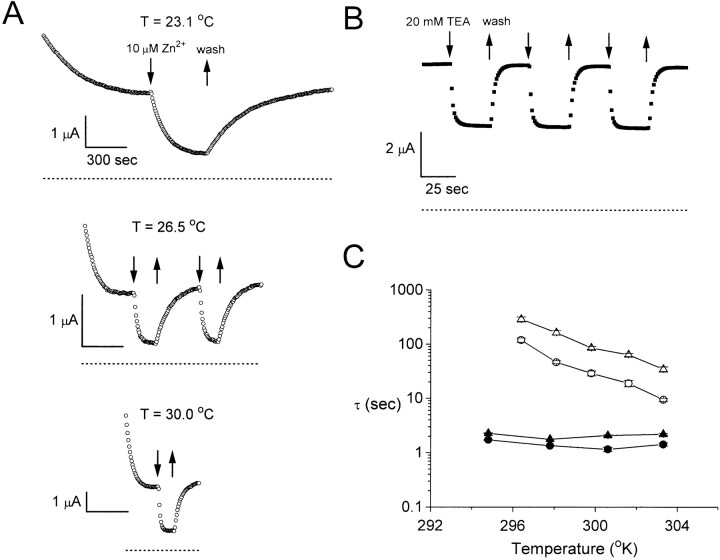
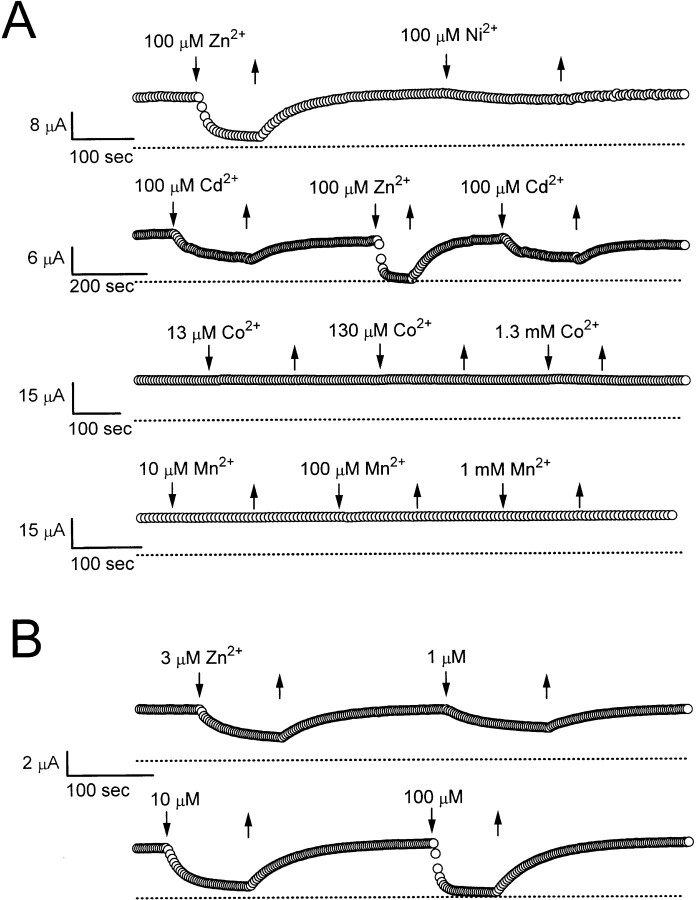
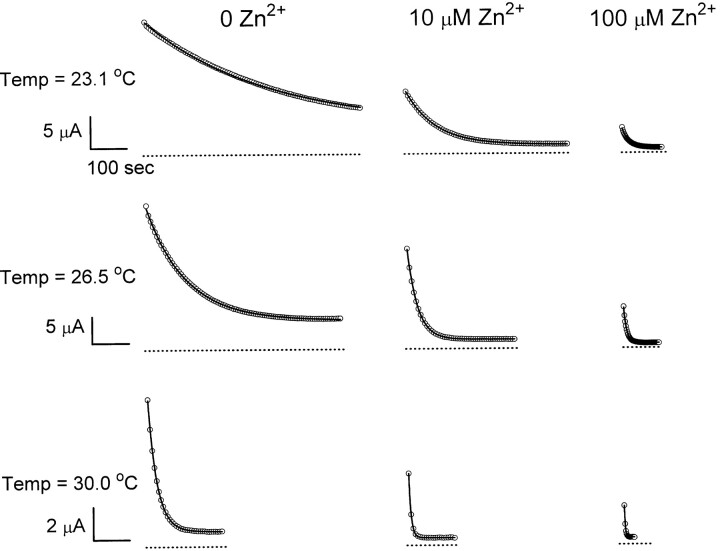
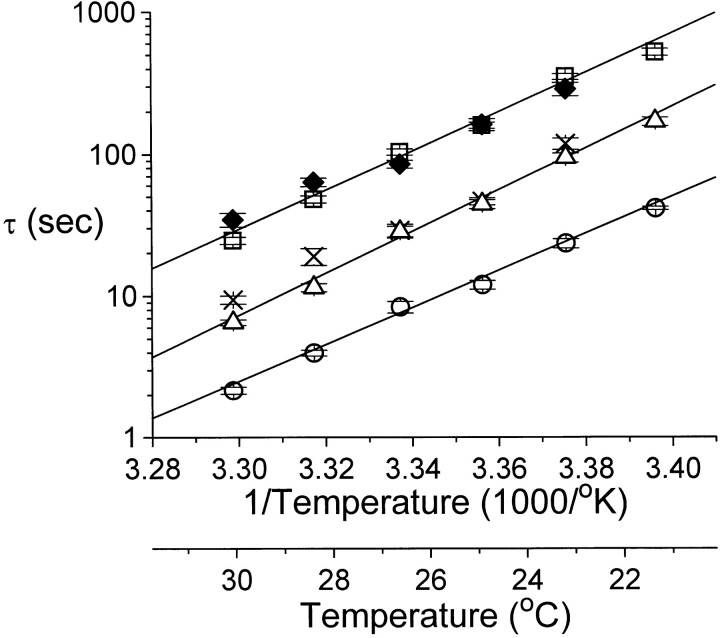
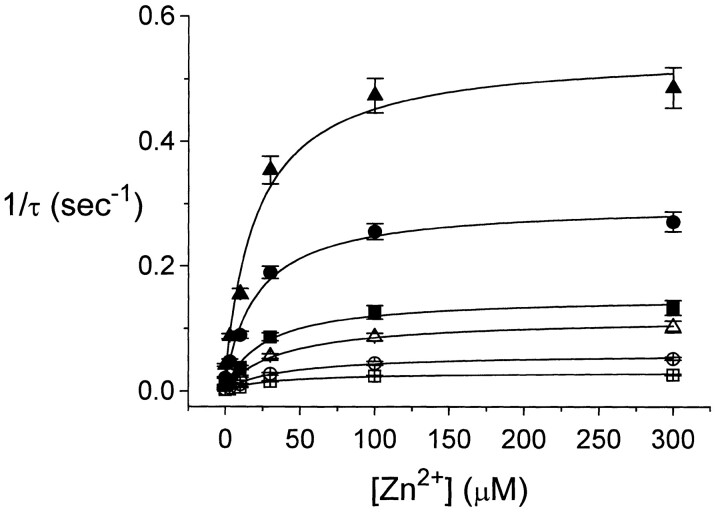
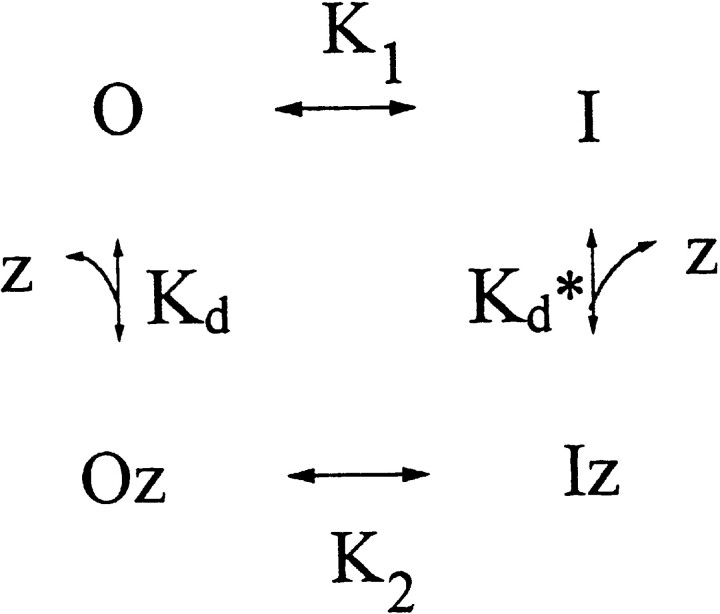
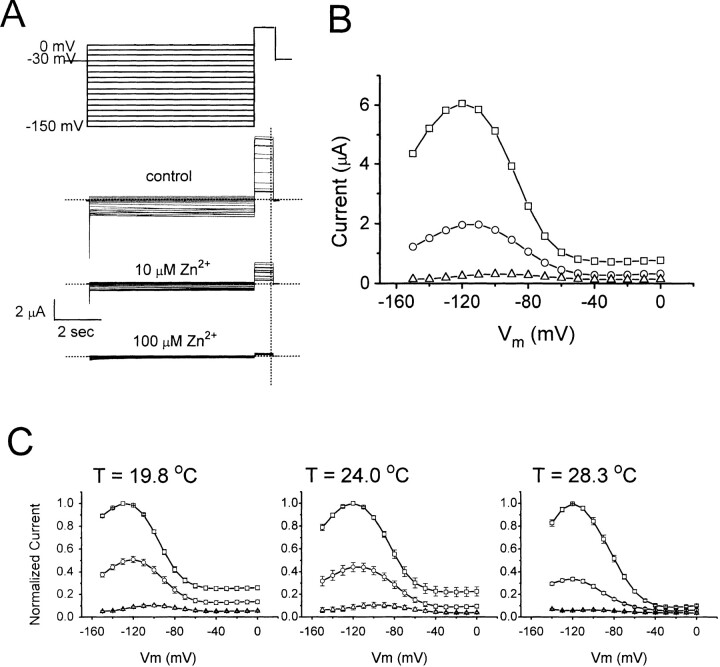
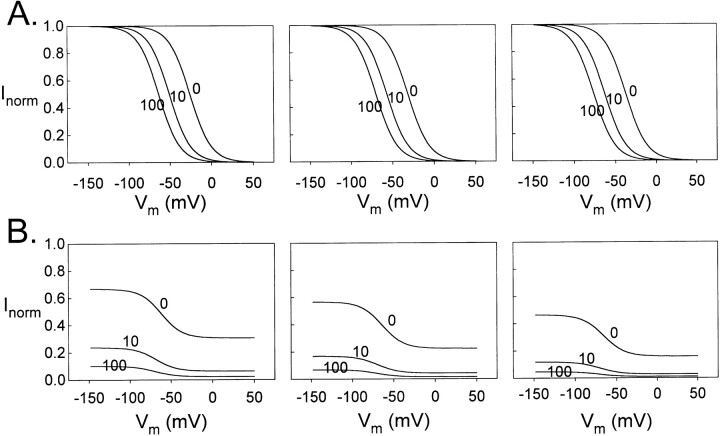
Extracellular Zn2+ was found to reversibly inhibit the ClC-0 Cl- channel. The apparent on and off rates of the inhibition were highly temperature sensitive, suggesting an effect of Zn2+ on the slow gating (or inactivation) of ClC-0. In the absence of Zn2+, the rate of the slow-gating relaxation increased with temperature, with a Q10 of approximately 37. Extracellular Zn2+ facilitated the slow-gating process at all temperatures, but the Q10 did not change. Further analysis of the rate constants of the slow-gating process indicates that the effect of Zn2+ is mostly on the forward rate (the rate of inactivation) rather than the backward rate (the rate of recovery from inactivation) of the slow gating. When ClC-0 is bound with Zn2+, the equilibrium constant of the slow-gating process is increased by approximately 30-fold, reflecting a 30-fold higher Zn2+ affinity in the inactivated channel than in the open-state channel. As examined through a wide range of membrane potentials, Zn2+ inhibits the opening of the slow gate with equal potency at all voltages, suggesting that a two-state model is inadequate to describe the slow-gating transition. Following a model originally proposed by Pusch and co-workers (Pusch, M., U. Ludewig, and T.J. Jentsch. 1997. J. Gen. Physiol. 109:105-116), the effect of Zn2+ on the activation curve of the slow gate can be well described by adding two constraints: (a) the dissociation constant for Zn2+ binding to the open channel is 30 microM, and (b) the difference in entropy between the open state and the transition state of the slow-gating process is increased by 27 J/ mol/ degreesK for the Zn2+-bound channel. These results together indicate that extracellular Zn2+ inhibits ClC-0 by facilitating the slow-gating process.


Figures

Figure 2
Figure 2
Extracellular Zn2+ has little effect on the fast gate of ClC-0. (A) Voltage protocol used to evaluate the fast gate of ClC-0. To focus on the fast gate, multiple short negative voltage pulses were applied to open the slow gate before the experiment. A −120-mV voltage step was first given to further ensure maximal activation of the slow gate (only partially shown in 1). The fast gate was then examined with a voltage pulse to +60 mV (2), followed by different test voltages from −160 to +80 mV in 20-mV steps (3). The tail currents were measured at −100 mV (4). (B) Families of currents in control (left), 10 μM Zn2+ (middle) and after Zn2+ washout (right). Dotted line shows level of zero current. (C) Steady state P o–V curves of the fast gate. ○, ▪, and □ are control, in 10 μM Zn2+, and wash, respectively (n = 4). Solid curves were drawn according to a simple voltage equilibrium: P o = P min + (P maxP min)/[1 + exp(−zF(V − Vo)/RT)], with z = 0.7–0.83, P max = 0.98–0.99, P min = 0.01–0.16, and Vo = −73 to −85 mV. The differences among the three P o-V curves were observed only at voltages more negative than −120 mV where the leak current contributed a relatively big fraction to the observed current. (D) Time constants of deactivation phase in period 3 plotted against membrane voltages. Symbols are as those in C.
Figure 3
Figure 3
Kinetics of Zn2+ inhibition and recovery are temperature sensitive. (A) Inhibition of ClC-0 by 10 μM Zn2+ at three different temperatures. (B) Inhibition of Shaker K+ channels by 20 mM TEA. The membrane potential was held at −80 mV and a 30-ms voltage pulse to +30 mV was given every second. Dotted lines in A and B represent zero-current level. (C) Comparison of the time constants of Zn2+ inhibition of ClC-0 (○ and ▵) with those of TEA inhibition of the Shaker K+ channel (• and ▴). Circles, time constants of current inhibition; triangles, time constants of current recovery (n = 4–5).
Figure 1
Figure 1
(A) Effects of various divalent metal ions on the steady state current of the ClC-0 Cl channel. The membrane potential of the oocyte was clamped at −30 or −40 mV. Each circle represents the current amplitude monitored by a 100-ms voltage pulse to +30 or +40 mV given every 5 or 6 s. Dotted lines show zero-current level. Solutions containing desired concentrations of various heavy metal ions were perfused in (downward arrows) and out (upward arrows), as indicated. (B) Concentration-dependent inhibition of the steady state current by Zn2+. Holding potential was at −30 mV. Continuous recording at 27.4°C for more than 50 min.
Figure 4
Figure 4
The slow-gating relaxation rate of ClC-0 is sensitive to both temperature and extracellular Zn2+. Dotted lines show zero-current level. Solid curves were the best fit to single-exponential functions. Time constants at 0, 10, and 100 μM Zn2+ were: (23.1°C) 332.9, 81.2, and 17.6 s; (26.5°C) 109.3, 27.9, and 8.1 s; and (30.0°C) 25.4, 6.0, and 2.4 s, respectively.
Figure 5
Figure 5
Arrhenius plot of the slow-gating relaxation time constants in various external [Zn2+]. The time constant τ of the slow-gating relaxation was evaluated from experiments similar to those shown in Fig. 4 (n = 7–8). Solid lines were the best fit to Y = A + BX, where Y is log10(τ) and X is the inverse of temperature. External [Zn2+] (μM) and the Q10s of the fitted lines were: (□) 0, 36.5; (▵) 10, 46.2; (○) 100, 29.7. × and ♦ are the time constants of Zn2+ inhibition and recovery shown in Fig. 3 C.
Figure 6
Figure 6
Slow-gating relaxation rate as a function of external [Zn2+]. Data points were fitted to Y = Y o + X · Y/(X + K 1/2). The fitted K 1/2s (μM) and Y/Yo were: (21.3°C, □) 33.2, 29.2; (23.1°C, ○) 40.4, 35.9; (24.8°C, ▵) 39.0, 26.3; (26.5°C, ▪) 26.6, 27.5; (28.3°C, •) 22.0, 18.6; (30.0°C, ▴) 21.5, 18.7. The increase of the inactivation rate by Zn2+, if all comes from the activation entropy, corresponds to an increase of ΔS of 24.3–29.8 J/mol per °K (see text for detailed discussion).
Scheme I
Scheme I
Figure 7
Figure 7
Effects of Zn2+ on the quasi–steady state activation curve of the slow gate. (A) Family of current traces elicited at 0, 10, and 100 μM Zn2+ with a voltage protocol shown on top. All traces were from the same oocyte at 24.0°C. The membrane potential was first held at −30 mV for the slow gating to reach steady state before each experiment started. Horizontal dotted lines indicate level of zero current. (B) Quasi–steady state activation curves at various Zn2+ concentrations from the experiment shown in A. The current amplitudes were measured at the vertical dotted line shown in B. □, ○, and ▵ represent control, 10, and 100 μM Zn2+, respectively. (C) Averaged quasi–steady state activation curves at 19.8, 24.0, and 28.3°C. Symbols are as those in B (n = 3–5).
Figure 8
Figure 8
Simulation for the effect of Zn2+ on the quasi– steady state activation curve of the slow gate. Activation curves were generated based on Scheme SI (A) and Scheme III (B) in the presence of 0, 10, and 100 μM Zn2+ at 20° (left), 24° (middle), and 28°C (right). The ratio of the occupation probability of any two states, A and B, is assumed to be of the form: 1/K AB = P A/P B = exp(−ΔG AB/RT) = exp(ΔS AB/R − ΔH AB/RT + z ABVF/RT), where K AB is the equilibrium constant, and ΔG AB, ΔS AB, and ΔH AB are the difference in Gibbs free energy, entropy, and enthalpy between the two states, respectively. R, T, and F have their usual meanings. V is the membrane voltage and z AB is the “gating valence” describing the voltage dependence of the transition A ↔ B. The values of the above parameters in the absence of Zn2+ were the same as those in a previous paper (Pusch et al., 1997) except for ΔH O1O2. They are shown as follows (ΔH in kJ/mol, ΔS in kJ/mol/°K): (A) ΔH OI = −80, ΔS OI = −0.29, z OI = −2; (B) ΔH O1I1 = −77, ΔS O1I1 = −0.26, z O1I1 = 0, ΔH O1O2 = 10, ΔS O1O2 = 0, z O1O2 = −2, ΔH O2I2 = −78, ΔS O2I2 = −0.27, z O2I2 = 0. Assigning 10 kJ/mol for ΔH O1O2 makes all curves in B shift to the left by ∼40 mV so that the curves from modeling are more similar to the experimental data with respect to their positions along the voltage axis. It does not affect the effect of Zn2+, which shifts the curve from top to bottom. Even with this adjustment, the assigned values in B do not provide a superb prediction for the plateau at positive voltages as they give a much larger noninactivated fractional current than the data shown in Fig. 7. This difference is not important since the pattern of Zn2+ inhibition is basically the same as that in the experimental data. The numbers 0, 10, and 100 indicate Zn2+ concentrations.
Scheme II
Scheme II

Similar articles

Cited by

References

    1. Backx PH, Yue DT, Lawrence JH, Marban E, Tomaselli GF. Molecular localization of an ion-binding site within the pore of mammalian sodium channels. Science. 1992;257:248–251. - PubMed
    1. Baukrowitz T, Yellen G. Modulation of K+ current by frequency and external [K+]: a tale of two inactivation mechanisms. Neuron. 1995;15:951–960. - PubMed
    1. Baukrowitz T, Yellen G. Use-dependent blockers and exit rate of the last ion from the multi-ion pore of a K+channel. Science. 1996;271:653–656. - PubMed
    1. Bretag AH, Fietz MJ, Bennet RRJ. The effects of zinc and other transition metal ions on rat skeletal muscle. Proc Aust Physiol Pharmacol Soc. 1984;15:146P. . (Abstr.)
    1. Chen T-Y, Miller C. Nonequilibrium gating and voltage dependence of the ClC-0 Cl−channel. J Gen Physiol. 1996;108:237–250. - PMC - PubMed

Publication types