. 1998 Dec;64(12):4950-7.
doi: 10.1128/AEM.64.12.4950-4957.1998.

Analysis of the dynamics of bacterial communities in the rhizosphere of the chrysanthemum via denaturing gradient gel electrophoresis and substrate utilization patterns

Affiliations

Analysis of the dynamics of bacterial communities in the rhizosphere of the chrysanthemum via denaturing gradient gel electrophoresis and substrate utilization patterns

BM Duineveld et al. Appl Environ Microbiol. 1998 Dec.

Abstract

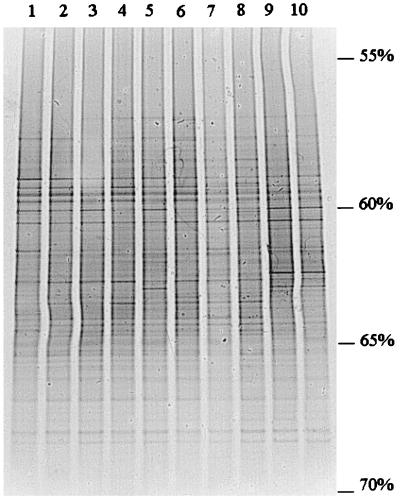
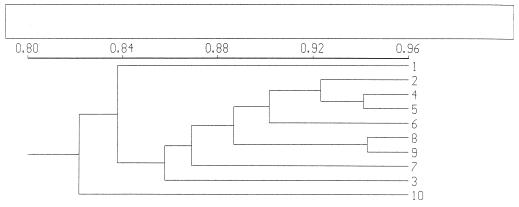
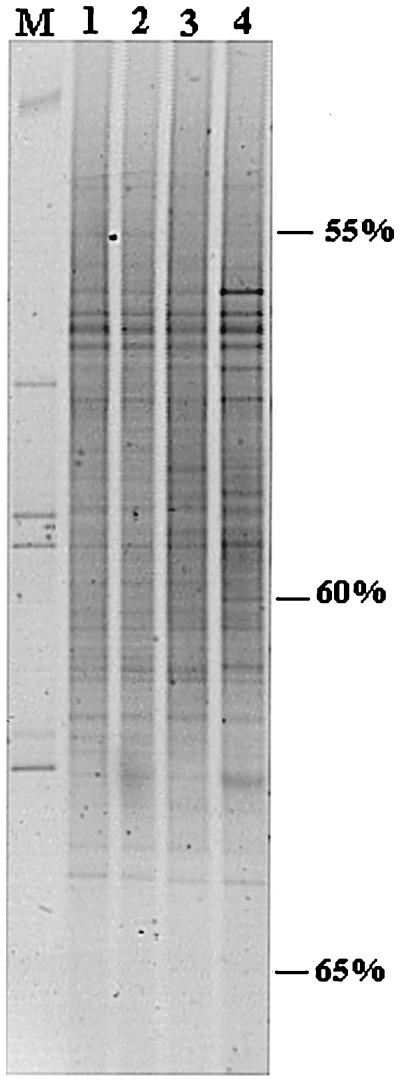
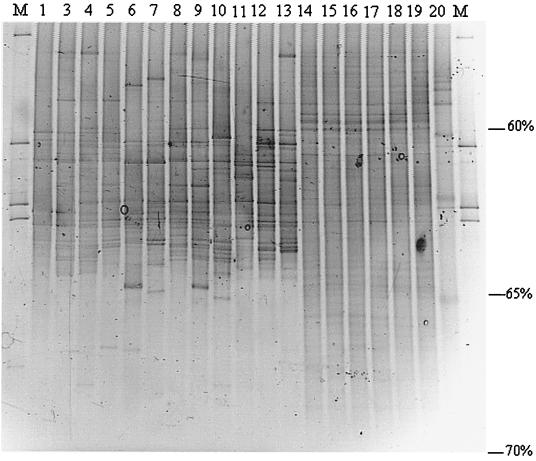
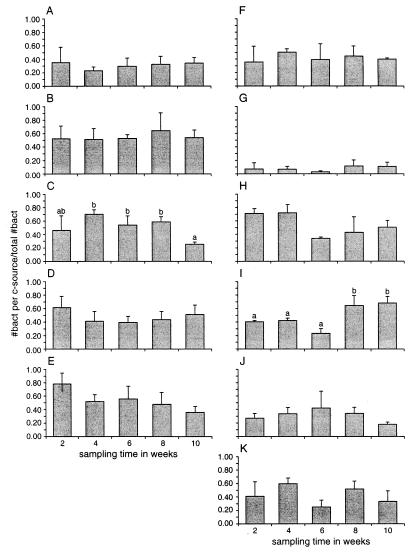
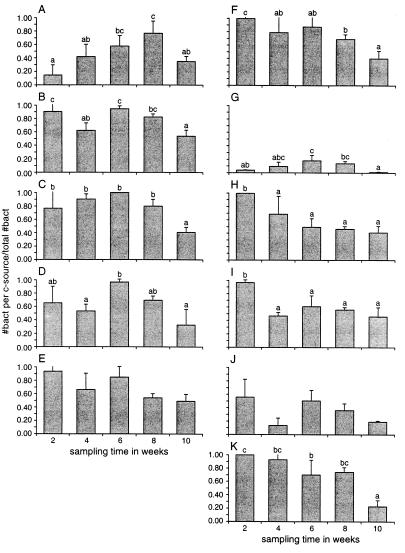
In order to gain a better understanding of the spatial and temporal dynamics of bacterial communities of the rhizosphere of the chrysanthemum, two complementary methods were used: a molecular bacterial community profiling method, i.e., 16S rRNA gene-based PCR followed by denaturing gradient gel electrophoresis (DGGE), and an agar plate method in which 11 sole-carbon-source utilization tests were used. The DGGE patterns showed that the bacterial communities as determined from direct rhizosphere DNA extracts were largely stable along developing roots of the chrysanthemum, with very little change over time or between root parts of different ages. The patterns were also similar to those produced with DNA extracts obtained from bulk soil samples. The DGGE patterns obtained by using microbial colonies from dilution plates as the source of target DNA were different from those found with the direct DNA extracts. Moreover, these patterns showed differences among plant replicates but also among replicate plates. Results obtained with the sole-carbon-source utilization tests indicated that the metabolic profile of the bacterial communities in the rhizosphere of the root tip did not change substantially during plant growth. This suggests selective development of specific bacterial populations by the presence of a root tip. On the other hand, the metabolic profile of bacterial communities in the rhizosphere of the root base changed during plant growth. With eight sole-carbon-source utilization tests, a significant effect of the development stage of the plant on the number of bacteria which were able to grow on these carbon sources was observed.


Figures

FIG. 1
FIG. 1
DGGE patterns of 16S ribosomal DNA (rDNA) fragments from rhizosphere samples of chrysanthemum plants collected at different development stages and from different sites of the root system. Lanes 1, 3, 5, 7, and 9, root tips of 2-, 4-, 6-, 8-, and 10-week-old plants, respectively; lanes 2, 4, 6, 8, and 10, root bases of 2-, 4-, 6-, 8-, and 10-week-old plants, respectively. Plants were grown in a loamy sand. Percent values indicate the percentage of denaturants at each position.
FIG. 2
FIG. 2
Dendrogram representing genetic similarity of microbial-community profiles obtained with PCR-DGGE. Samples were collected at different moments of plant development and from different root sites. 1, 3, 5, 7, and 9, root tips of 2-, 4-, 6-, 8-, and 10-week-old plants, respectively; 2, 4, 6, 8, and 10, root bases of 2-, 4-, 6-, 8-, and 10-week-old plants, respectively.
FIG. 3
FIG. 3
DGGE patterns of 16S rDNA fragments from rhizosphere and bulk soil (loamy sand). Lane 1, bulk soil mixed with perlite, not incubated; lane 2, bulk soil without perlite incubated for 14 days; lane 3, bulk soil mixed with perlite and incubated for 14 days under the same conditions used for plant growth; lane 4, rhizosphere soil of root tip samples of a 2-week-old chrysanthemum plant. M, marker, composed of PCR products generated from the following strains (from top to bottom): Enterobacter cloacae BE1, Listeria innocua ALM105, Rhizobium leguminosarum biovar trifolii R62, Arthrobacter sp., and Burkholderia cepacia P2. Percent values indicate the percentage of denaturants at each position.
FIG. 4
FIG. 4
DGGE patterns of 16S rDNA fragments of microbial growth on 0.1 TSA plates of rhizosphere samples and directly extracted bacterial DNA of bulk soil samples. The profiles obtained from agar plates are from three 6-week-old plants, i.e., plant 1 tip (lanes 1 and 2) and base (lanes 3 and 4), plant 2 tip (lanes 5 and 6) and base (lanes 7 and 8), and plant 3 tip (lanes 9 and 10) and base (lanes 11 and 12). The bulk soil samples used were treated in three ways: mixed with perlite and analyzed with no incubation time (lanes 13 and 14), mixed with perlite and incubated for 14 days under the same conditions used for plant growth (lanes 15 and 16), and without perlite, incubated for 14 days (lanes 17 and 18). Lane M, marker composed of PCR products generated from the following strains (from top to bottom): E. cloacae BE1, L. innocua ALM105, R. leguminosarum biovar trifolii R62, Arthrobacter sp., and B. cepacia P2. Percent values indicate the percentage of denaturants at each position.
FIG. 5
FIG. 5
Dendrogram representing genetic similarity of PCR-DGGE-obtained profiles of microbial growth on 0.1 TSA plates of rhizosphere samples and directly extracted bacterial DNA of bulk soil samples. The profiles obtained from agar plates are from three 6-week-old plants, i.e., plant 1 tip (1 and 2) and base (3 and 4), plant 2 tip (5 and 6) and base (7 and 8), and plant 3 tip (9 and 10) and base (11 and 12). The bulk soil samples used were treated in three ways: mixed with perlite and analyzed with no incubation time (13 and 14), mixed with perlite and incubated for 14 days under the same conditions used for plant growth (15 and 16), without perlite, incubated for 14 days (17 and 18).
FIG. 6
FIG. 6
Fraction of bacteria isolated from the tips of chrysanthemum roots which could use a single carbon source. The total number of bacteria which could grow on 0.1 TSA was set to 1. Root tip samples were collected from three chrysanthemum plants at different developmental stages. Samples were tested on starch (A), sucrose (B), maltose (C), fructose (D), glucose (E), fucose (F), oxalate (G), succinate (H), serine (I), glutamine (J), and phenylalanine (K). Bars marked with the same letters are not significantly different from each other. (P < 0.05).
FIG. 7
FIG. 7
Fraction of bacteria isolated from the base of chrysanthemum roots which could use a single carbon source. The total number of bacteria which could grow on 0.1 TSA was set to 1. Root base samples were collected from three chrysanthemum plants at different developmental stages. Samples were tested on starch (A), sucrose (B), maltose (C), fructose (D), glucose (E), fucose (F), oxalate (G), succinate (H), serine (I), glutamine (J), and phenylalanine (K). Bars marked with the same letters are not significantly different (P < 0.05).

References

    1. Bowen G D, Rovira A D. The rhizosphere, the hidden half. In: Waisel Y, Eshel A, Kafkafi U, editors. Plant roots—the hidden half. New York, N.Y: Marcel Dekker; 1991. pp. 641–649.
    1. Curl E A, Truelove B. The rhizosphere. New York, N.Y: Springer; 1986.
    1. De Leij F A A M, Whipps J M, Lynch J M. The use of colony development for the characterization of bacterial communities in soil and roots. Microb Ecol. 1993;27:81–97. - PubMed
    1. Felske A, Rheims H, Wolterink A, Stackebrandt E, Akkermans A D L. Ribosome analysis reveals prominent activity of an uncultured member of the class Actinobacteria in grassland soils. Microbiology. 1997;143:2983–2989. - PubMed
    1. Garland J L, Mills A L. Classification and characterization of heterotrophic microbial communities on the basis of patterns of community-level sole-carbon-source utilization. Appl Environ Microbiol. 1991;57:2351–2359. - PMC - PubMed

LinkOut - more resources