. 1998 Dec 7;188(11):2083-90.
doi: 10.1084/jem.188.11.2083.

2B4, the natural killer and T cell immunoglobulin superfamily surface protein, is a ligand for CD48

Affiliations

2B4, the natural killer and T cell immunoglobulin superfamily surface protein, is a ligand for CD48

M H Brown et al. J Exp Med. .

Abstract

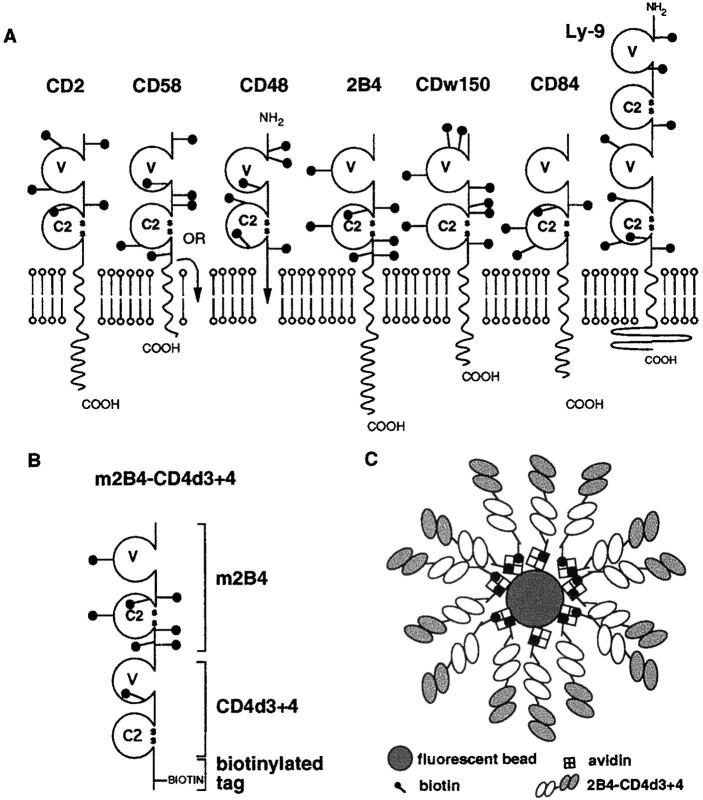
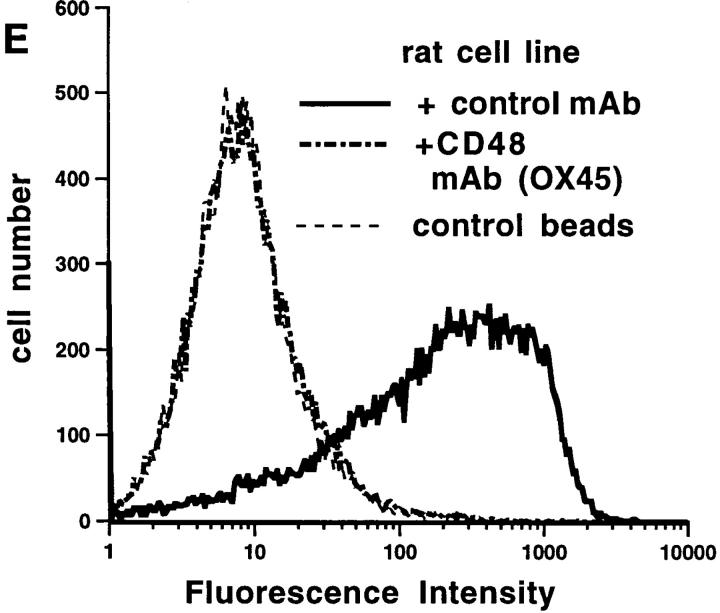
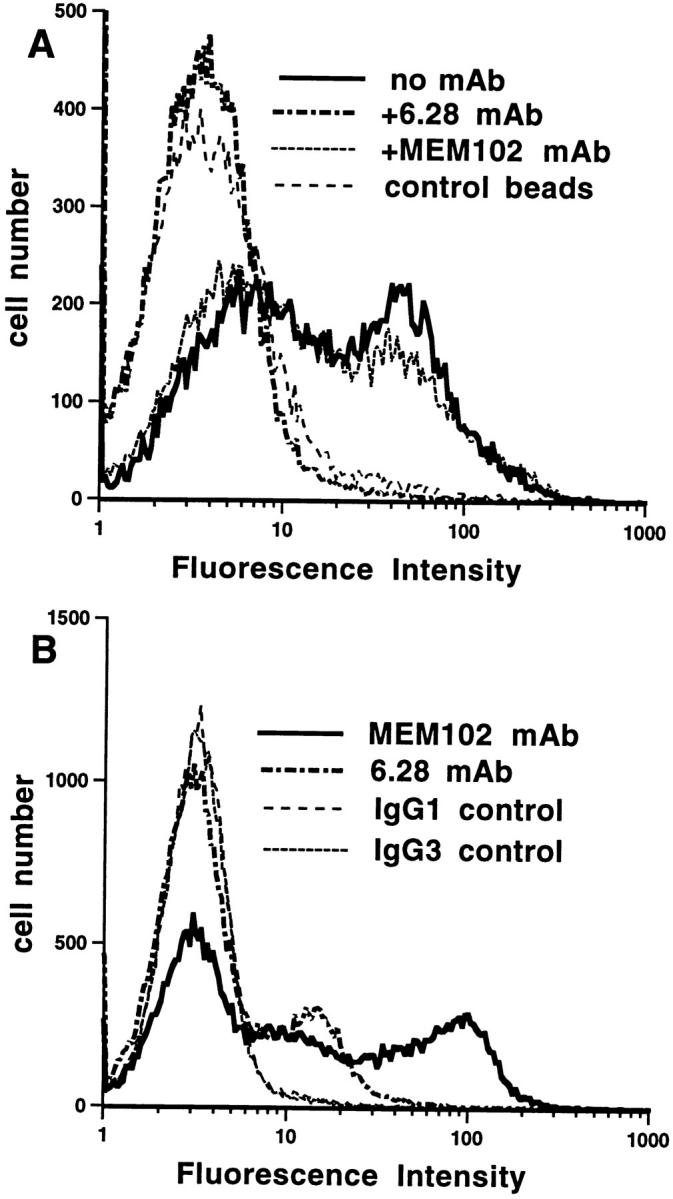
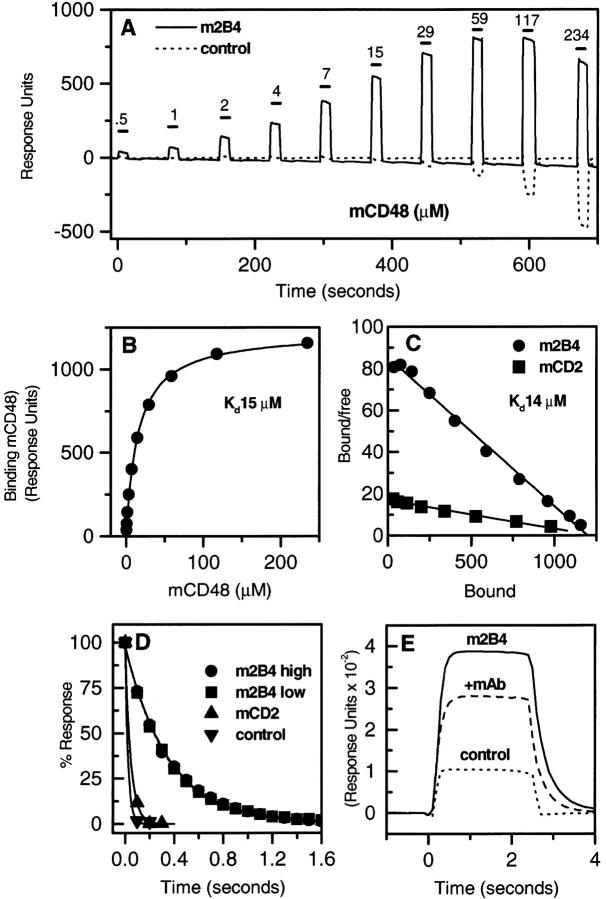
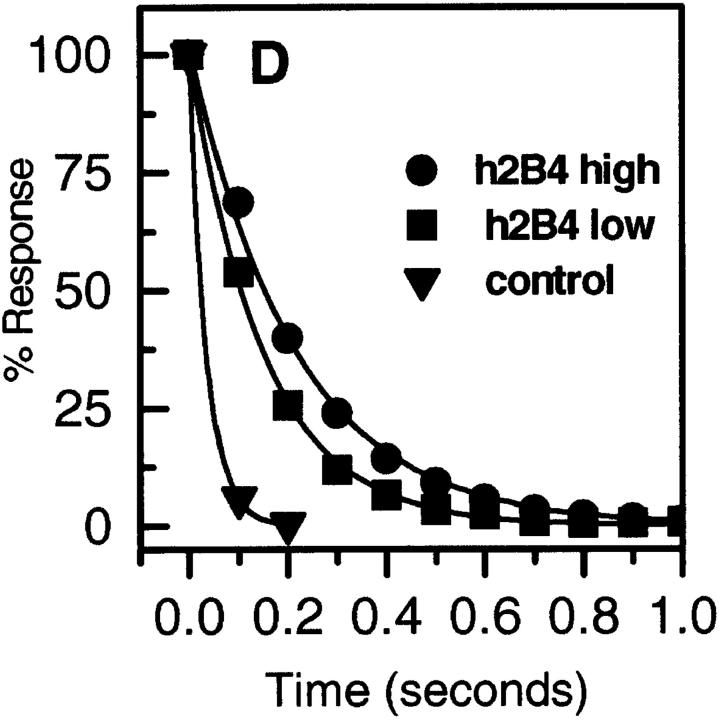
2B4 is a cell surface glycoprotein related to CD2 and implicated in the regulation of natural killer and T lymphocyte function. A recombinant protein containing the extracellular region of mouse (m)2B4 attached to avidin-coated fluorescent beads bound to rodent cells, and binding was completely blocked by CD48 monoclonal antibodies (mAbs). Using surface plasmon resonance, we showed that purified soluble mCD48 bound m2B4 with a six- to ninefold higher affinity (Kd approximately 16 microM at 37 degreesC) than its other ligand, CD2. Human CD48 bound human 2B4 with a similar affinity (Kd approximately 8 microM). The finding of an additional ligand for CD48 provides an explanation for distinct functional effects observed on perturbing CD2 and CD48 with mAbs or by genetic manipulation.


Figures

Figure 1
Figure 1
CD2 IgSF subfamily. (A) Schematic representation of mouse CD2, CD48, 2B4, and Ly-9 and human CD58, CDw150 (SLAM), and CD84. (B) Recombinant chimeric m2B4-CD4d3+4 protein. (C) The 2B4-CD4d3+4 fluorescent beads used for ligand identification.
Figure 2
Figure 2
m2B4-CD4d3+4 fluorescent beads bind to rodent CD48 on cells. m2B4-CD4d 3+4 fluorescent beads bind to LPS (A and D) and Con A (B)– activated and resting (C) mouse spleen cells and a rat basophilic leukemia cell line (E). Preincubation of cells with mCD48 mAbs OX78 (A and B) or HM48-1 (C) or rCD48 mAb (E) blocked binding to the level seen with the negative control, rCD5-CD4d3+4. Control mCD2 mAb (A and B), mCD3 mAb 2C11 (C), or rCD147 mAb (E) did not block binding. Preincubation of m2B4-CD4d3+4 fluorescent beads with 2B4 mAb but not a CD4d3+4 mAb partially blocks binding to cells (D).
Figure 2
Figure 2
m2B4-CD4d3+4 fluorescent beads bind to rodent CD48 on cells. m2B4-CD4d 3+4 fluorescent beads bind to LPS (A and D) and Con A (B)– activated and resting (C) mouse spleen cells and a rat basophilic leukemia cell line (E). Preincubation of cells with mCD48 mAbs OX78 (A and B) or HM48-1 (C) or rCD48 mAb (E) blocked binding to the level seen with the negative control, rCD5-CD4d3+4. Control mCD2 mAb (A and B), mCD3 mAb 2C11 (C), or rCD147 mAb (E) did not block binding. Preincubation of m2B4-CD4d3+4 fluorescent beads with 2B4 mAb but not a CD4d3+4 mAb partially blocks binding to cells (D).
Figure 3
Figure 3
h2B4-CD4d3+4 fluorescent beads bind to hCD48 on cells. (A) h2B4-CD4d3+4 fluorescent beads bind to PBMCs. Preincubation of cells with hCD48 mAb 6.28 but not MEM 102 blocked binding to the level seen with the negative control, rCD4d3+4. (B) CD48 mAbs 6.28 and MEM 102 bind to the cells in A as detected with a fluorescent- labeled second mAb.
Figure 4
Figure 4
Affinity and dissociation rate of soluble mCD48 binding to m2B4-CD4d3+4. (A) Soluble mCD48 was injected at the indicated concentration through flow cells with immobilized m2B4-CD4d3+4 (3,733 RU) or as a negative control, rCD5-CD4d3+4 (1,857 RU), at 37°C. (B) The difference between the response at equilibrium in the m2B4-CD4d3+4 and control flow cells is plotted against the mCD48 concentration. A K d = 15 μM and maximum binding of 1,197–1,225 RU were calculated by nonlinear curve fitting of the Langmuir binding isotherm (line) to data (circles) from A with negative control subtracted. (C) Scatchard plot of data in B plus data for mCD48 binding mCD2. (D) Soluble mCD48 (23.4 μM) was injected over immobilized m2B4-CD4d3+4 at high (1,060 RU) and low (572 RU) levels, mCD2 (557 RU), and rCD5-CD4d3+4 (1,083 RU). A k off = 3 s−1 for 2B4, 22 s−1 for mCD2, and 41 s−1 for rCD5-CD4d3+4 was calculated by exponential decay curve fitting (line) to dissociation data (symbols). (E) In the experiment shown in D, soluble mCD48 (23.4 μM) was injected over immobilized m2B4-CD4d3+4 (1,060 RU) before and after saturation with 2B4 mAb.
Figure 5
Figure 5
Affinity and dissociation rate of soluble hCD48 binding to h2B4-CD4d3+4. (A) Soluble hCD48 was injected at the indicated concentration through flow cells with immobilized h2B4-CD4d3+4 (2,166 RU) or as a negative control, CD4d3+4 (2,112 RU), at 37°C. (B) The difference between the response at equilibrium in the h2B4-CD4d3+4 and control flow cells is plotted against the hCD48 concentration. A K d = 8 μM and maximum binding of 945–959 RU were calculated by nonlinear curve fitting of the Langmuir binding isotherm (line) to data (circles) from A with negative control subtracted. (C) Scatchard plot of data in B. (D) Soluble hCD48 (14.4 μM) was injected over immobilized h2B4-CD4d3+4 at high (1,073 RU) and low levels (578 RU), and CD4d3+4 (1,782 RU). A k off = 5 s−1 for 2B4 high, 7 s−1 for h2B4 low, and 41 s−1 for CD4d3+4 was calculated by exponential decay curve fitting (line) to dissociation data (symbols).
Figure 5
Figure 5
Affinity and dissociation rate of soluble hCD48 binding to h2B4-CD4d3+4. (A) Soluble hCD48 was injected at the indicated concentration through flow cells with immobilized h2B4-CD4d3+4 (2,166 RU) or as a negative control, CD4d3+4 (2,112 RU), at 37°C. (B) The difference between the response at equilibrium in the h2B4-CD4d3+4 and control flow cells is plotted against the hCD48 concentration. A K d = 8 μM and maximum binding of 945–959 RU were calculated by nonlinear curve fitting of the Langmuir binding isotherm (line) to data (circles) from A with negative control subtracted. (C) Scatchard plot of data in B. (D) Soluble hCD48 (14.4 μM) was injected over immobilized h2B4-CD4d3+4 at high (1,073 RU) and low levels (578 RU), and CD4d3+4 (1,782 RU). A k off = 5 s−1 for 2B4 high, 7 s−1 for h2B4 low, and 41 s−1 for CD4d3+4 was calculated by exponential decay curve fitting (line) to dissociation data (symbols).

References

    1. Barclay, A.N., M.H. Brown, S.K.A. Law, A.J. McKnight, M.G. Tomlinson, and P.A. van der Merwe. 1997. The Leucocyte Antigen Factsbook. 2nd ed. Academic Press Ltd., London. 613 pp.
    1. Preston S, Wright GJ, Starr K, Barclay AN, Brown MH. The leukocyte/neuron cell surface antigen OX2 binds to a ligand on macrophages. Eur J Immunol. 1997;27:1911–1918. - PubMed
    1. Hunig T. The cell surface molecule recognized by the erythrocyte receptor of T lymphocytes. Identification and partial characterization using a monoclonal antibody. J Exp Med. 1985;162:890–901. - PMC - PubMed
    1. Selvaraj P, Plunkett ML, Dustin M, Sanders ME, Shaw S, Springer TA. The T lymphocyte glycoprotein CD2 binds the cell surface ligand LFA-3. Nature. 1987;326:400–403. - PubMed
    1. Kato K, Koyanaga M, Okada H, Takanashi T, Wong YW, Williams AF, Okumura K, Yagita H. CD48 is a counter-receptor for mouse CD2 and involved in T cell activation. J Exp Med. 1992;176:1241–1249. - PMC - PubMed

Publication types