. 1998 Dec;118(4):1337-44.
doi: 10.1104/pp.118.4.1337.

Distribution of sulfur within oilseed rape leaves in response to sulfur deficiency during vegetative growth

Affiliations

Distribution of sulfur within oilseed rape leaves in response to sulfur deficiency during vegetative growth

MM Blake-Kalff et al. Plant Physiol. 1998 Dec.

Abstract

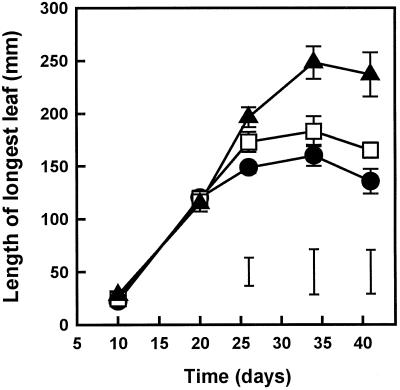
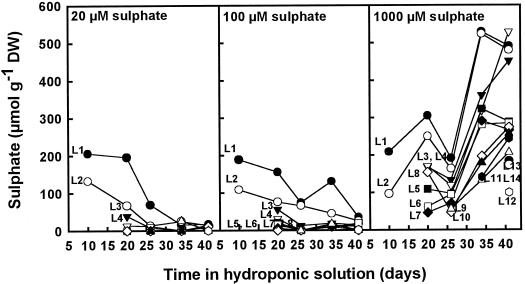
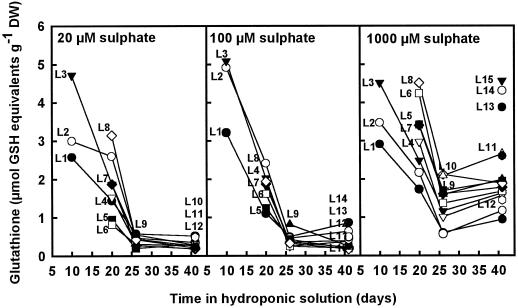
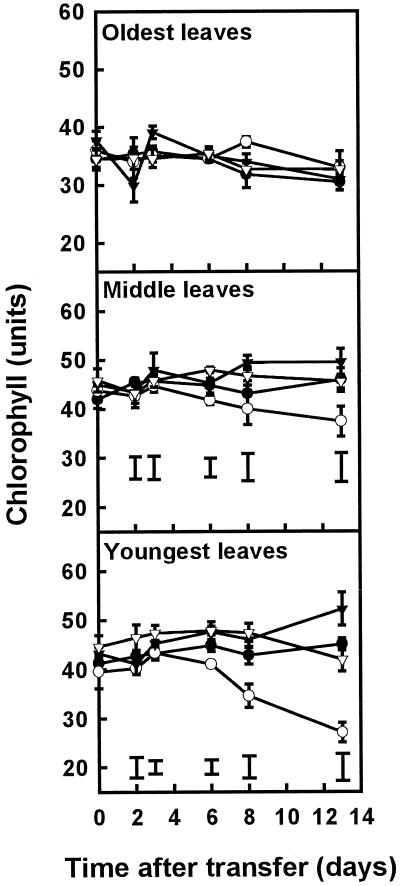
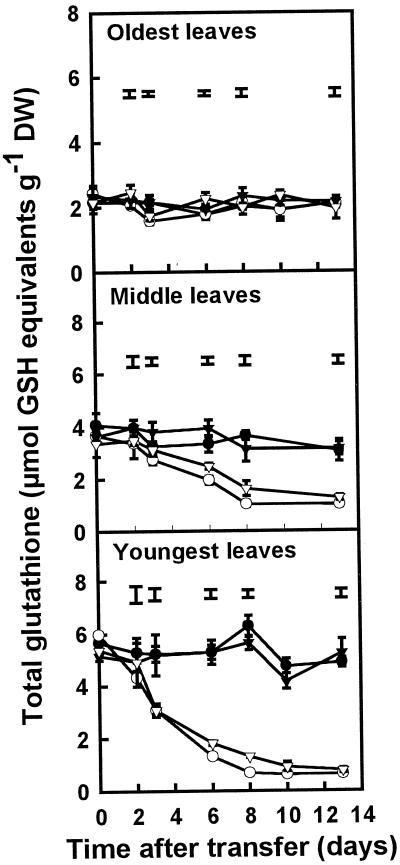
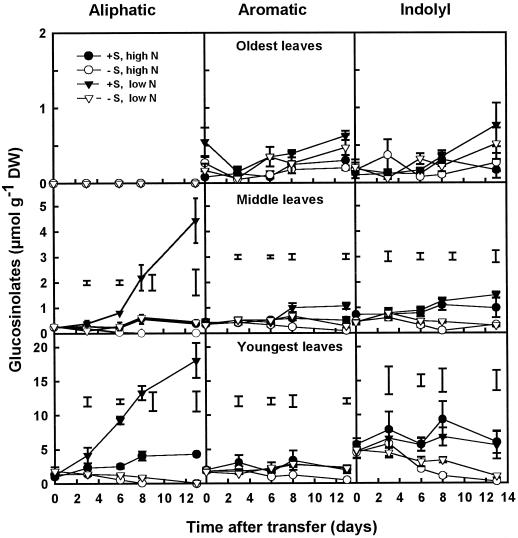
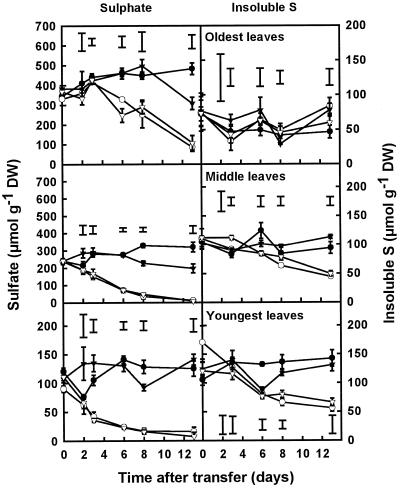
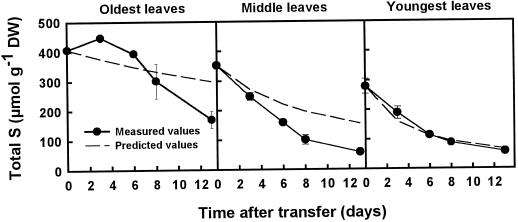
The distribution of S to sulfate, glucosinolates, glutathione, and the insoluble fraction within oilseed rape (Brassica napus L.) leaves of different ages was investigated during vegetative growth. The concentrations of glutathione and glucosinolates increased from the oldest to the youngest leaves, whereas the opposite was observed for SO42-. The concentration of insoluble S was similar among all of the leaves. At sufficient S supply and in the youngest leaves, 2% of total S was allocated to glutathione, 6% to glucosinolates, 50% to the insoluble fraction, and the remainder accumulated as SO42-. In the middle and oldest leaves, 70% to 90% of total S accumulated as SO42-, whereas glutathione and glucosinolates together accounted for less than 1% of S. When the S supply was withdrawn (minus S), the concentrations of all S-containing compounds, particularly SO42-, decreased in the youngest and middle leaves. Neither glucosinolates nor glutathione were major sources of S during S deficiency. Plants grown on nutrient solution containing minus S and low N were less deficient than plants grown on solution containing minus S and high N. The effect of N was explained by differences in growth rate. The different responses of leaves of different ages to S deficiency have to be taken into account for the development of field diagnostic tests to determine whether plants are S deficient.


Figures

Figure 1
Figure 1
Effect of external S supply on leaf development in oilseed rape. Plants were grown continuously in nutrient solutions containing 20, 100, or 1000 μm SO42−. The effect of increasing SO42− concentrations was similar in all of the leaves, but for clarity only the length of the longest leaf is presented. Data represent the means ± se of four separate plants. The lsd (P < 0.05) for each time point is shown by vertical bars. •, 20 μm SO42−; □, 100 μm SO42−; ▴, 1000 μm SO42−.
Figure 2
Figure 2
SO42− concentrations in leaves of different ages grown in nutrient solutions containing 20, 100, or 1000 μm SO42− throughout the experimental period. The data shown are a representative example of two different experiments. DW, Dry weight.
Figure 3
Figure 3
Total glutathione concentrations (GSH plus GSSH) in leaves of different ages in nutrient solutions containing 20, 100, or 1000 μm SO42− throughout the experimental period. The data shown are a representative example of two different experiments. DW, Dry weight.
Figure 4
Figure 4
Chlorophyll readings in the oldest, middle, and youngest leaves of plants grown in the presence or absence of SO42− at either high (7 mm) or low (0.25 mm) NO3. Plants were grown for 3 weeks on 1 mm SO42− and 7 mm NO3 before transfer to the four different treatments at d 0. Data are the means ± se of three separate plant samples. The lsd (P < 0.05) for each time point is shown by vertical bars. There was no significant difference between treatments in the oldest leaves. Open symbols, minus S; closed symbols, plus S; circles, high N; triangles, low N.
Figure 5
Figure 5
Total glutathione concentrations (GSH plus GSSG) in the oldest, middle, and youngest leaves of plants grown in the presence or absence of SO42− at either high (7 mm) or low (0.25 mm) NO3. Plants were grown for 3 weeks on 1 mm SO42− and 7 mm NO3 before transfer to the four different treatments at d 0. Data are the means ± se of three separate plant samples. The lsd (P < 0.05) for each time point is shown by vertical bars. There was no significant difference between treatments in the oldest leaves. Open symbols, minus S; closed symbols, plus S; circles, high N; triangles, low N. DW, Dry weight.
Figure 6
Figure 6
Glucosinolate concentrations in the oldest, middle, and youngest leaves of plants grown in the presence or absence of SO42− at either high (7 mm) or low (0.25 mm) NO3. Plants were grown for 3 weeks on 1 mm SO42− and 7 mm NO3 before transfer to the four different treatments at d 0. Data are the means ± se of three separate plant samples. For clarity, the y axes for the oldest, middle, and youngest leaves are presented at different scales. The lsd (P < 0.05) for each time point is shown by vertical bars. There was no significant difference between treatments in the oldest leaves. Open symbols, minus S; closed symbols, plus S; circles, high N; triangles, low N. DW, Dry weight.
Figure 7
Figure 7
Concentrations of SO42− and insoluble S in the oldest, middle, and youngest leaves of plants grown in the presence or absence of SO42− at either high (7 mm) or low (0.25 mm) NO3. Plants were grown for 3 weeks on 1 mm SO42− and 7 mm NO3 before transfer to the four different treatments at d 0. Data are the means ± se of three separate plant samples. The lsd (P < 0.05) for each time point is shown by vertical bars. For clarity, the SO42− concentrations of the youngest leaves are presented on a smaller scale. Open symbols, minus S; closed symbols, plus S; circles, high N; triangles, low N. DW, Dry weight.
Figure 8
Figure 8
Concentrations of total S in the oldest, middle, and youngest leaves of plants grown in the absence of S and at high (7 mm) NO3 compared with the predicted values for each leaf type. Predictions were based on the growth rate, assuming that no S was transported into or out of each plant part, and therefore predicted values represent a dilution curve attributable to growth. Closed circles, Measured values; dashed lines, predicted values. DW, Dry weight.

References

    1. Anderson ME. Tissue glutathione. In: Greenwald RA, editor. Handbook of Methods for Oxygen Radical Research. Boca Raton, FL: CRC Press; 1985. pp. 317–323.
    1. Barney PE, Bush LP. Interaction of nitrate and sulfate reduction in tobacco. I. Influence of availability of nitrate and sulfate. J Plant Nutr. 1985;8:505–515.
    1. Bell CI, Clarkson DT, Cram WJ. Sulfate supply and its regulation of transport in roots of a tropical legume Macroptilium atropurpureum cv. Siratro. J Exp Bot. 1995;46:65–71.
    1. Chew FS. Biological effects of glucosinolates. In: Cutler HG, editor. Biologically Active Natural Products: Potential Use in Agriculture. Washington, DC: American Chemical Society; 1988. pp. 155–181.
    1. Clarkson DT, Saker LR. Sulfate influx in wheat and barley roots becomes more sensitive to specific protein-binding reagents when plants are sulfate-deficient. Planta. 1989;178:249–257. - PubMed

LinkOut - more resources