. 1999 Jan;73(1):110-9.
doi: 10.1128/JVI.73.1.110-119.1999.

Colocalization of baculovirus IE-1 and two DNA-binding proteins, DBP and LEF-3, to viral replication factories

Affiliations

Colocalization of baculovirus IE-1 and two DNA-binding proteins, DBP and LEF-3, to viral replication factories

K Okano et al. J Virol. 1999 Jan.

Abstract

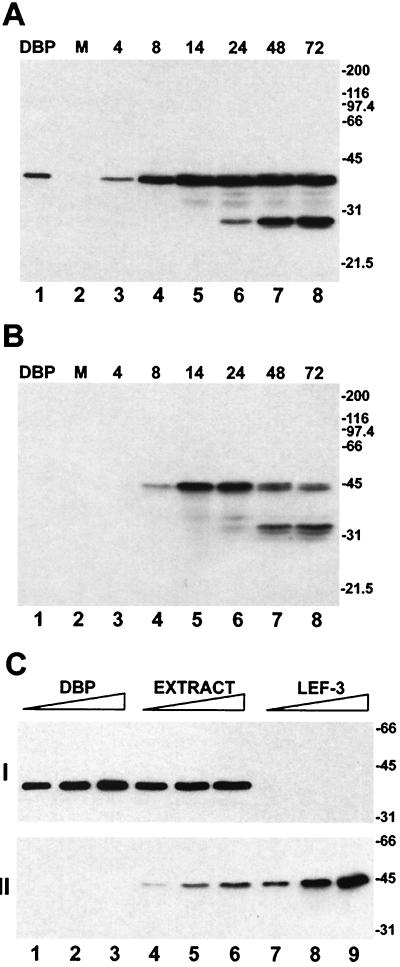
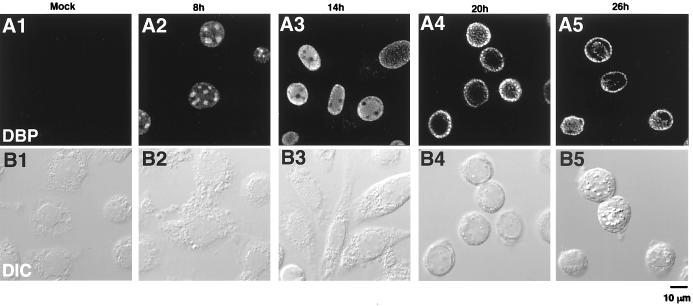
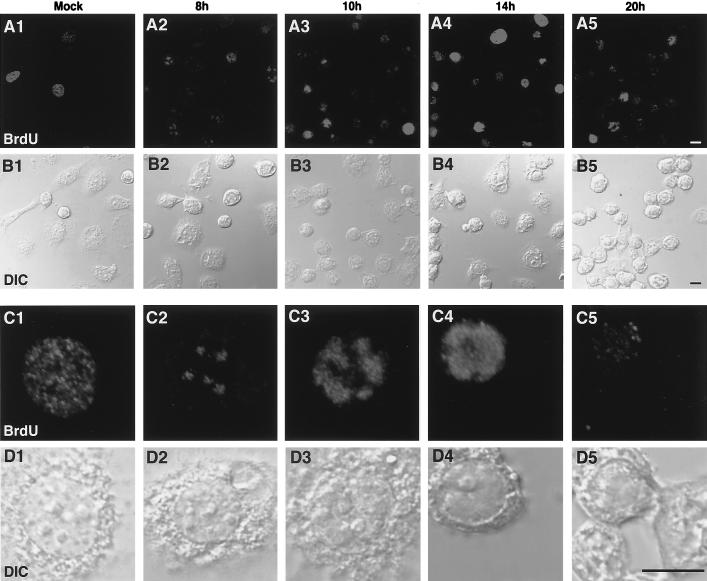
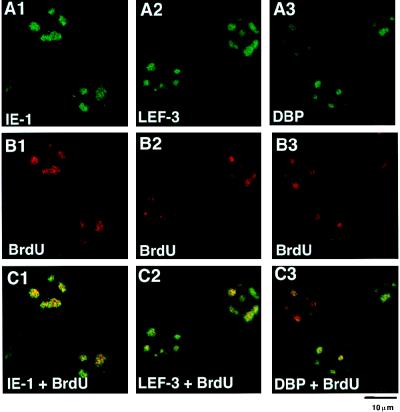
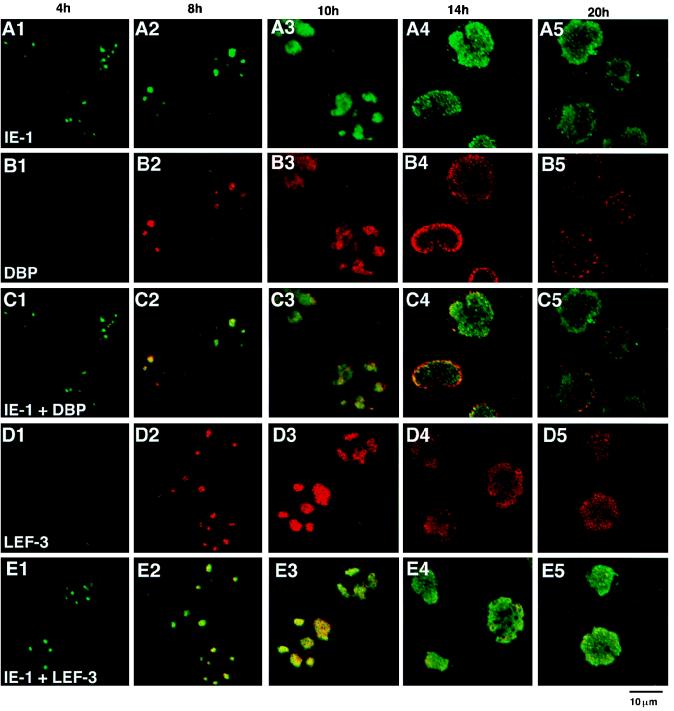
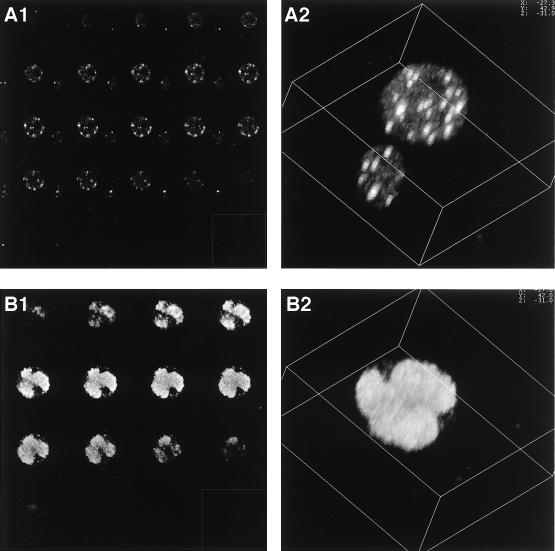
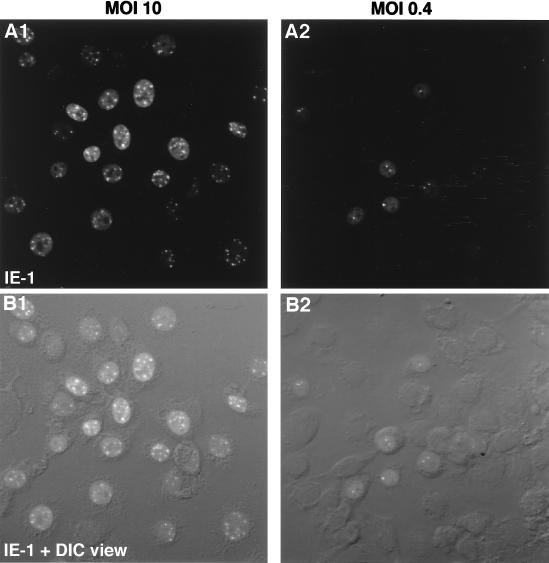
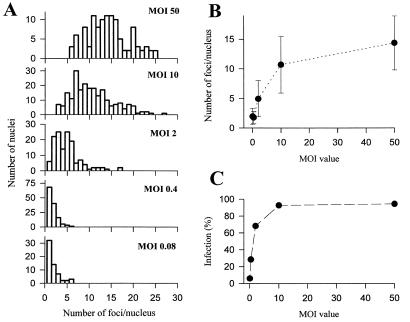
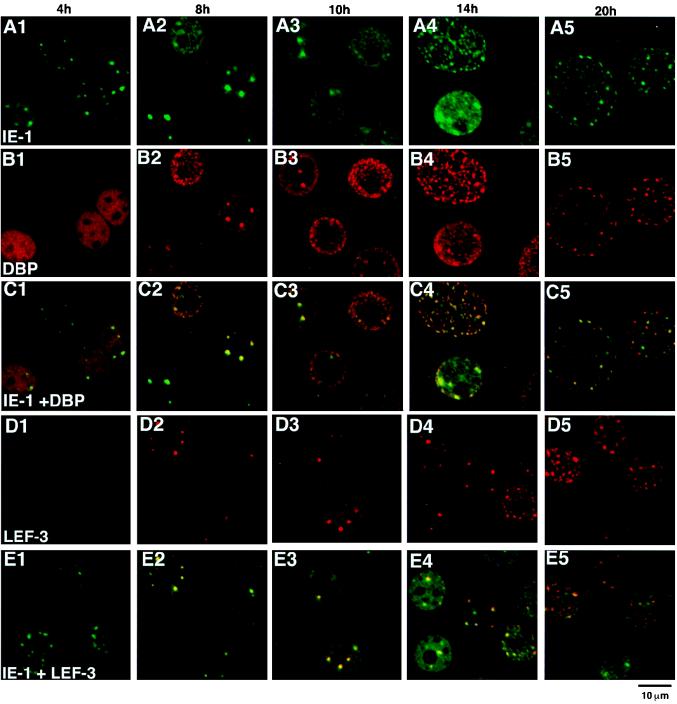
We have recently identified a DNA-binding protein (DBP) from the baculovirus Bombyx mori nucleopolyhedrovirus (BmNPV) which can destabilize double-stranded DNA (V. S. Mikhailov, A. L. Mikhailova, M. Iwanaga, S. Gomi, and S. Maeda, J. Virol. 72:3107-3116, 1998). DBP was found to be an early gene product that was not present in budded or occlusion-derived virions. In order to characterize the localization of DBP during viral replication, BmNPV-infected BmN cells were examined by immunostaining and confocal microscopy with DBP antibodies. DBP first appeared as diffuse nuclear staining at 4 to 6 h postinfection (p.i.) and then localized to several specific foci within the nucleus at 6 to 8 h p.i. After the onset of viral DNA replication at around 8 h p.i., these foci began to enlarge and eventually occupied more than half of the nucleus by 14 h p.i. After the termination of viral DNA replication at about 20 h p.i., the DBP-stained regions appeared to break down into approximately 100 small foci within the nucleus. At 8 h p.i., the distribution of DBP as well as that of IE-1 or LEF-3 (two proteins involved in baculovirus DNA replication) overlapped well with that of DNA replication sites labeled with bromodeoxyuridine incorporation. Double-staining experiments with IE-1 and DBP or IE-1 and LEF-3 further confirmed that, between 8 and 14 h p.i., the distribution of IE-1 and LEF-3 overlapped with that of DBP. However, IE-1 localized to the specific foci prior to DBP or LEF-3 at 4 h p.i. In the presence of aphidicolin, an inhibitor of DNA synthesis, immature foci containing IE-1, LEF-3, and DBP were observed by 8 h p.i. However, the subsequent enlargement of these foci was completely suppressed, suggesting that the enlargement depended upon viral DNA replication. At 4 h p.i., the number of IE-1 foci correlated with the multiplicity of infection (MOI) between 0.4 and 10. At higher MOIs (e.g., 50), the number of foci plateaued at around 15. These results suggested that there are about 15 preexisting sites per nucleus which are associated with the initiation of viral DNA replication and assembly of viral DNA replication factories.


Figures

FIG. 1
FIG. 1
Western blot analysis of DBP and LEF-3 in BmNPV-infected BmN cells. (A and B) Time course of the accumulation of DBP and LEF-3 in BmNPV-infected cells. Extracts (5 × 10⁴ cells) were prepared from mock-infected cells (lanes 2) or from BmNPV-infected cells collected at the indicated times p.i. (lanes 3 to 8) as described in Materials and Methods. The cell extracts were separated by SDS–11% PAGE followed by Western blotting with antiserum against DBP (A) or LEF-3 (B). Purified DBP (10 ng) was analyzed for lanes 1. (C) Quantitative determination of DBP and LEF-3 in BmNPV-infected BmN cells. The extract was prepared from infected cells collected at 14 h p.i. and analyzed by SDS–11% PAGE in amounts equivalent to 0.8 × 10⁴ cells (lane 4), 2 × 10⁴ cells (lane 5), or 4 × 10⁴ cells (lane 6). The purified proteins analyzed in the same gel were taken in the following amounts: DBP, 20 ng (lane 1), 50 ng (lane 2), and 100 ng (lane 3); LEF-3, 20 ng (lane 7), 50 ng (lane 8), and 100 ng (lane 9). The proteins were detected by Western blotting with antiserum against DBP (I) and then antiserum against LEF-3 (II). The migration of molecular size markers (sizes in kilodaltons) is shown to the right of each blot.
FIG. 2
FIG. 2
Distribution of DBP in BmNPV-infected BmN cells. (A) DBP immunofluorescence images. (B) Differential interface contrast images of the same fields as in panel A. BmN cells were mock infected (column 1) or infected with BmNPV for 8, 14, 20, or 26 h (columns 2 to 5, respectively) and then fixed with 2% formalin for 10 min, permeabilized with cold acetone for 2 min, and incubated with anti-DBP antibody followed by FITC-conjugated goat anti-rabbit IgG. The bar indicates 10 μm.
FIG. 3
FIG. 3
Distribution of DNA replication sites in BmNPV-infected BmN cells. (A and C) BrdU immunofluorescence images. (B and D) Differential interface contrast images of the same fields as in panels A and C, respectively. In panels C and D, higher magnifications of specific cells in panels A and B are shown. Note that infection-specific BrdU incorporation appeared as unique foci at 8 h p.i. The size and intensity of these foci increased until 14 h p.i. BrdU incorporation then diminished at 20 h p.i. BmN cells were mock infected (column 1) or infected with BmNPV for 8, 10, 14, or 20 h (columns 2 to 5, respectively). Cells were labeled with 10 μM BrdU for 30 min prior to fixation in 2% formalin. The fixed cells were permeabilized with acetone and treated with 4 N HCl for 10 min to expose incorporated BrdU residues. The cells were then incubated with anti-BrdU antibody followed by rhodamine red X-conjugated goat anti-mouse IgG. Bars, 10 μm.
FIG. 4
FIG. 4
Double staining of BmNPV-infected BmN cells with BrdU and IE-1, LEF-3, or DBP. (A) Immunofluorescence images of BmNPV-infected BmN cells at 8 h p.i. with antibodies against IE-1 (A1), LEF-3 (A2), or DBP (A3). For IE-1 staining, FITC-conjugated goat anti-guinea pig IgG was used. For DBP and LEF-3 staining, FITC-conjugated goat anti-rabbit IgG was used. (B) BrdU immunofluorescence images of the same cells as in panel A. For BrdU staining, rhodamine red X-conjugated goat anti-mouse IgG was used. (C) Panels A and B merged.
FIG. 5
FIG. 5
Double staining of BmNPV-infected BmN cells with IE-1 and DBP or IE-1 and LEF-3. (A) IE-1 immunofluorescence images. (B) DBP immunofluorescence images of the same fields as in panel A. (C) Panels A and B merged. (D) LEF-3 immunofluorescence images. (E) Panel D and the corresponding IE-1 immunofluorescence images (not shown) merged. The time p.i. is shown at the top of each column. For IE-1 staining, FITC-conjugated goat anti-guinea pig IgG was used. For DBP and LEF-3 staining, Cy-5-conjugated goat anti-rabbit IgG was used.
FIG. 6
FIG. 6
3D images of IE-1 distribution. (A) IE-1 immunofluorescence images taken at 4 h p.i. Twenty-four optical sections (A1) were used to reconstitute the 3D image of IE-1 foci observed at 4 h p.i. by using Leica 3D software. Even though the pinhole size was reduced to 80% of the optimum value for the lens (water immersion type PLAPO63) that was used, substantial blurring was observed along the z axis. However, the number of foci could still be accurately estimated. The distribution of the foci did not correlate with visible structures such as the nuclear membrane or nucleoli. (B) IE-1 fluorescence images taken at 14 h p.i. To reconstitute the 3D image of IE-1 foci at 14 h p.i. (B2), 16 optical sections (B1) were used.
FIG. 7
FIG. 7
Effect of MOI on the number of IE-1 foci at 4 h p.i. (A1 and B1) MOI of 10. (A2 and B2) MOI of 0.4. BmN cells were fixed at 4 h p.i. and subjected to immunofluorescence visualization. Primary antibody, anti IE-1; secondary antibody, FITC-conjugated goat anti-guinea pig IgG. To evaluate the number of IE-1 foci within the entire nuclei, eight consecutive fluorescence sections of cell nuclei were combined and projected onto a single plane by using Leica extended-focus software. (A) IE-1 immunofluorescence images. (B) Differential interface contrast images and the corresponding IE-1 immunofluorescence images from panel A merged.
FIG. 8
FIG. 8
Quantitative analyses of the relationship between MOI and the number of IE-1 foci at 4 h p.i. (A) Distribution histogram. BmN cells infected with BmNPV at the indicated MOI were fixed at 4 h p.i. and subjected to immunofluorescence visualization. Primary antibody, anti IE-1; secondary antibody, FITC-conjugated goat anti-guinea pig IgG. Only infected cells containing nuclei with IE-1 foci (staining) were taken for the analysis. At least five images in each case were analyzed. Abscissas indicate the numbers of foci per nucleus (bin size = 1), and ordinates indicate the numbers of nuclei with corresponding numbers of foci per nucleus. (B) Relationship between MOI and the number of IE-1 foci per nucleus. (C) Relationship between MOI and infection percentage [(number of positively stained cells/number of total cells)] × 100].
FIG. 9
FIG. 9
Distribution of DBP, LEF-3, and IE-1 in the presence of aphidicolin. Aphidicolin (20 μM) was added to the culture medium at time zero to inhibit viral and cellular DNA replication. (A) IE-1 immunofluorescence images. (B) DBP immunofluorescence images of the same fields as in panel A. (C) Panels A and B merged. (D) LEF-3 immunofluorescence images. (E) Panel D and the corresponding IE-1 immunofluorescence images (not shown) merged. The time p.i. is shown at the top of each column. For IE-1 staining, FITC-conjugated goat anti-guinea pig IgG was used. For DBP or LEF-3 staining, Cy-5-conjugated goat anti-rabbit IgG was used.

References

    1. Ahn J H, Hayward G S. The major immediate-early proteins IE1 and IE2 of human cytomegalovirus colocalize with and disrupt PML-associated nuclear bodies at very early times in infected permissive cells. J Virol. 1997;71:4599–4613. - PMC - PubMed
    1. Ahrens C H, Carlson C, Rohrmann G F. Identification, sequence, and transcriptional analysis of lef-3, a gene essential for Orgyia pseudotsugata baculovirus DNA replication. Virology. 1995;210:372–382. - PubMed
    1. Ahrens C H, Rohrmann G F. The DNA polymerase and helicase genes of a baculovirus of Orgyia pseudotsugata. J Gen Virol. 1996;77:825–837. - PubMed
    1. Ahrens C H, Rohrmann G F. Identification of essential trans-acting regions required for DNA replication of the Orgyia pseudotsugata multinucleocapsid nuclear polyhedrosis virus: lef-1 is an essential replication gene. Virology. 1995;207:417–428. - PubMed
    1. Ahrens C H, Rohrmann G F. Replication of Orgyia pseudotsugata baculovirus DNA: lef-2 and ie-1 are essential and ie-2, p34, and Op-iap are stimulatory genes. Virology. 1995;212:650–662. - PubMed

Publication types

Substances

LinkOut - more resources