

doi: 10.1101/gad.12.23.3639.
Transcription factor CREM coordinates the timing of hepatocyte proliferation in the regenerating liver
Affiliations
- PMID: 9851970
- PMCID: PMC317249
- DOI: 10.1101/gad.12.23.3639
Item in Clipboard
Transcription factor CREM coordinates the timing of hepatocyte proliferation in the regenerating liver
Genes Dev.
.
Abstract
The liver regenerates upon partial hepatectomy (PH) as terminally differentiated hepatocytes undergo a tremendous proliferative process. CREM gene expression is powerfully induced during liver regeneration. We show that cell proliferation is significantly reduced upon PH in CREM-/- mice. There is a reduction in DNA synthesis, in the number of mitosis and of phosphorylated histone H3-positive cells. The post-PH proliferation peak is delayed by 10 hr, indicating an altered hepatocyte cell cycle. Expression of cyclins A, B, D1, E, and cdc2, of c-fos and tyrosine aminotransferase is deregulated. CREM mutation results in delayed S-phase entry, impairing the synchronization of proliferation.
Figures
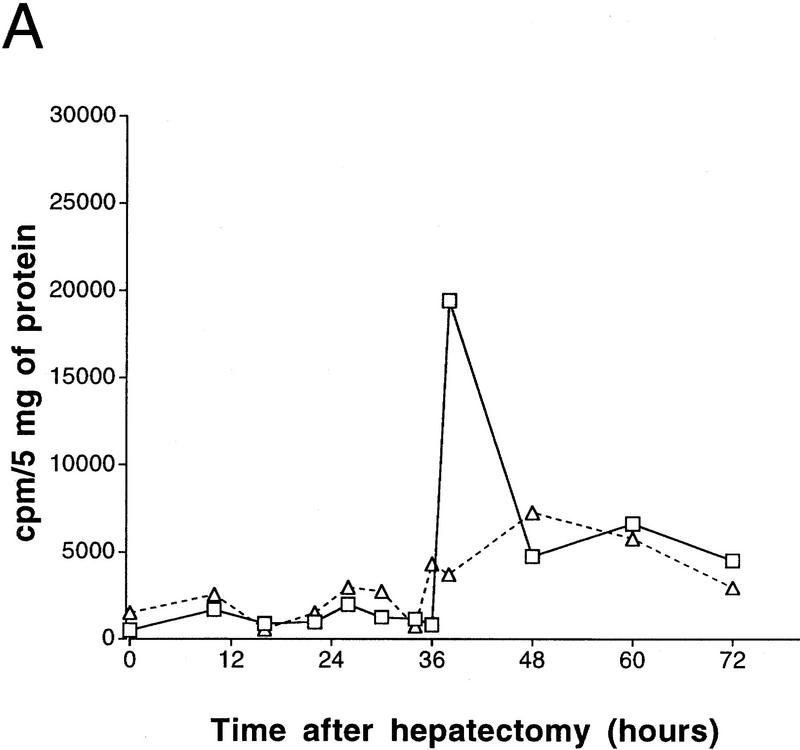
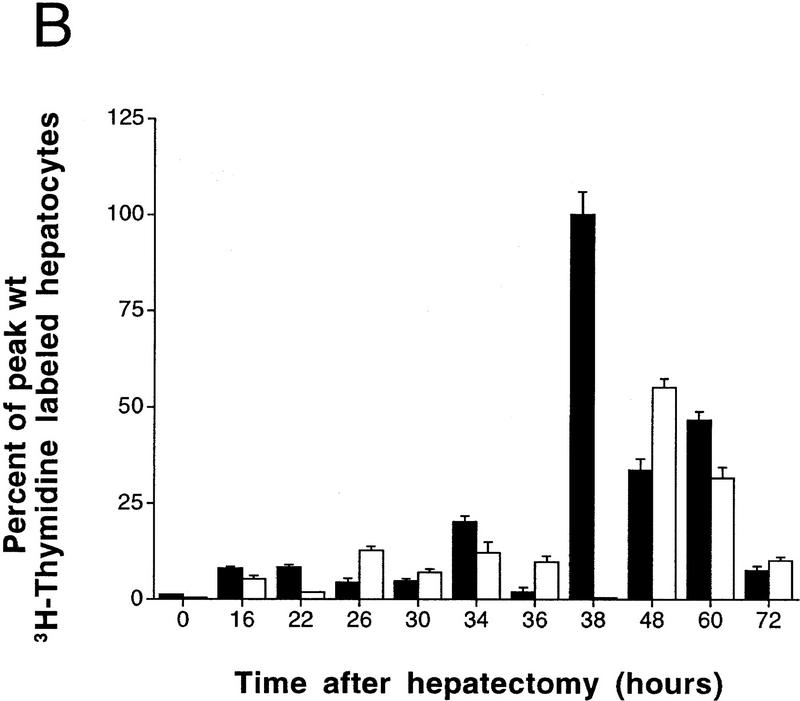
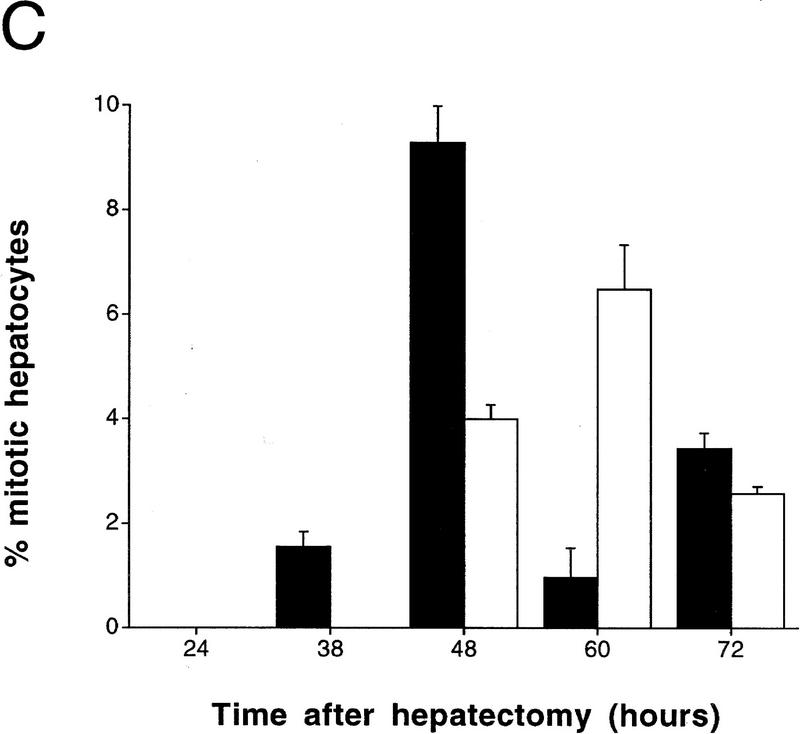
Delayed peak of hepatocyte proliferation in CREM-deficient mice. (A) Kinetics of [3H]thymidine incorporation into DNA during wild-type (□) and CREM−/− (▵) liver regeneration (0–72 hr after PH). [3H]Thymidine incorporation was determined using scintillation counting and expressed as counts/min/5 mg of protein. (B) Percentage of positive dark-stained hepatocyte nuclei during [3H]thymidine incorporation. The time point with highest incorporation (38 hr in wild type) was considered 100% with respect to the other time points. (C) Mitotic figures in hepatocytes were counted and quantitated as a percentage of the total number of hepatocytes in 10 high-power fields by two investigators at the indicated times after PH. (B,C) (█ Wild type; □ CREM−/−) s.e.m. is shown.
Delayed peak of hepatocyte proliferation in CREM-deficient mice. (A) Kinetics of [3H]thymidine incorporation into DNA during wild-type (□) and CREM−/− (▵) liver regeneration (0–72 hr after PH). [3H]Thymidine incorporation was determined using scintillation counting and expressed as counts/min/5 mg of protein. (B) Percentage of positive dark-stained hepatocyte nuclei during [3H]thymidine incorporation. The time point with highest incorporation (38 hr in wild type) was considered 100% with respect to the other time points. (C) Mitotic figures in hepatocytes were counted and quantitated as a percentage of the total number of hepatocytes in 10 high-power fields by two investigators at the indicated times after PH. (B,C) (█ Wild type; □ CREM−/−) s.e.m. is shown.
Delayed peak of hepatocyte proliferation in CREM-deficient mice. (A) Kinetics of [3H]thymidine incorporation into DNA during wild-type (□) and CREM−/− (▵) liver regeneration (0–72 hr after PH). [3H]Thymidine incorporation was determined using scintillation counting and expressed as counts/min/5 mg of protein. (B) Percentage of positive dark-stained hepatocyte nuclei during [3H]thymidine incorporation. The time point with highest incorporation (38 hr in wild type) was considered 100% with respect to the other time points. (C) Mitotic figures in hepatocytes were counted and quantitated as a percentage of the total number of hepatocytes in 10 high-power fields by two investigators at the indicated times after PH. (B,C) (█ Wild type; □ CREM−/−) s.e.m. is shown.
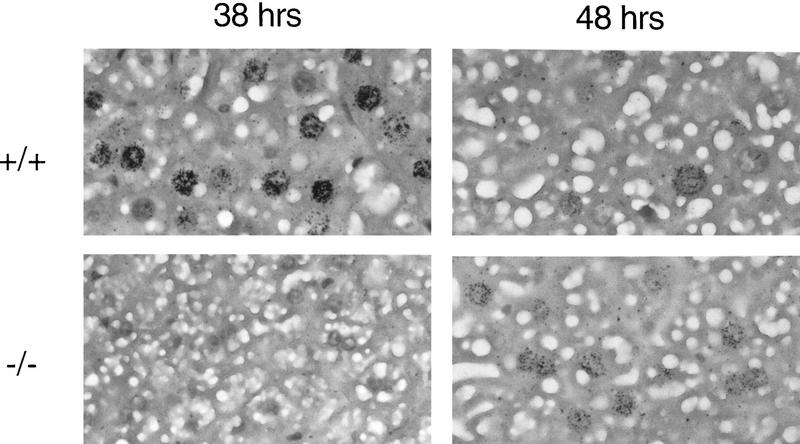
Histological analysis of labeled nuclei during liver regeneration. Autoradiography shows positive hepatocyte nuclei in wild-type (+/+) and mutant (−/−) animals. Intensity is proportional to the relative levels of [3H]thymidine incorporation.
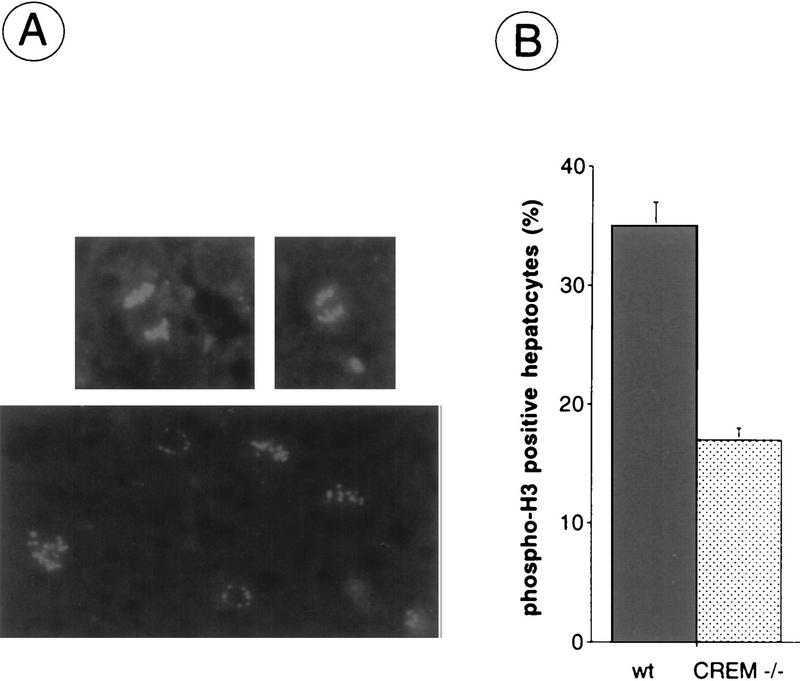
Labeling of hepatocytes showing phospho-H3 at 48 hr after PH. (A) Representative micrographs of mitotic figures (top panels) and labeled nuclei (bottom panel) designating phospho-H3-positive cells visible during liver regeneration. (B) Number of phospho-H3-positive hepatocytes observed at 48 hr after PH. Values are shown (s.e.m. ) collected over 20 fields of observations.
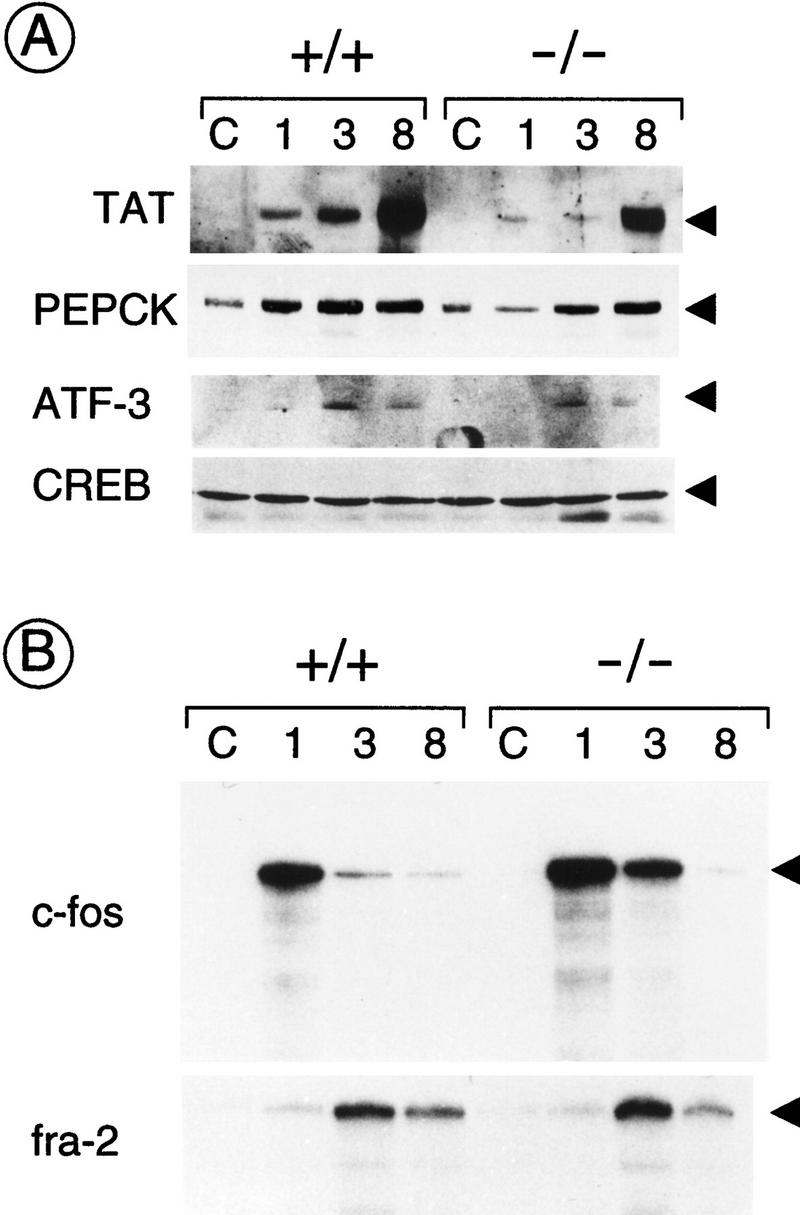
Gene expression in the first hours of liver regeneration after PH. (A) Western blot analysis using anti-TAT and anti-PEPCK antibodies of mice liver extracts from animals at various times after PH (1, 3, and 8 hr). Western blot analysis of lysates using an anti-CREB antibody confirms that the same amount of total protein has been loaded in each lane (bottom panel). (B) RNase protection analysis of c-fos and fra-2 expression using total RNA from regenerating liver at various times after PH (1, 3, and 8 hr). This experiment was performed several times with consistent results. Expression of c-fos at the 3 hr time point is fivefold higher (±0.5) in CREM mutant mice vs. wild type, as established after scanning various autoradiographs.
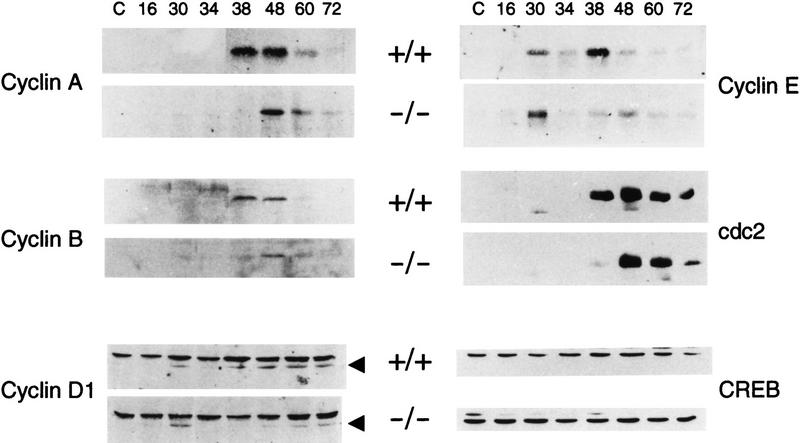
Aberrant cyclin expression in the regenerating liver of CREM-deficient mice. Western blot analysis of mice liver extracts at different times after PH (hours) using antibodies against cyclins A, B1, D1, E, and cdc2. Analysis using an anti-CREB antibody shows that the same amount of total protein is loaded in each lane.
References
-
- Albrecht JH, Hoffman JS, Kren BT, Steer CJ. Cyclin and cyclin-dependent kinase 1 mRNA expression in models of regenerating liver and human liver diseases. Am J Physiol. 1993;265:G857–G864. - PubMed
-
- Albrecht JH, Hu MY, Cerra FB. Distinct patterns of cyclin D1 regulation in models of liver regeneration and human liver. Biochem Biophys Res Commun. 1995;209:648–655. - PubMed
-
- Bucher NLR. Regeneration of mammalian liver. Int Rev Cytol. 1963;15:245–300. - PubMed
-
- Cressman DE, Greenbaum LE, De Angelis RA, Ciliberto G, Furth EE, Poli V, Taub R. Liver failure and defective hepatocyte regeneration in interleukin-6-deficient mice. Science. 1996;274:1379–1383. - PubMed
Publication types
MeSH terms
Substances
LinkOut - more resources
Full Text Sources
Other Literature Sources
Molecular Biology Databases
Miscellaneous