. 1998 Dec;180(24):6697-703.
doi: 10.1128/JB.180.24.6697-6703.1998.

Genome size, complexity, and ploidy of the pathogenic fungus Histoplasma capsulatum

Affiliations

Genome size, complexity, and ploidy of the pathogenic fungus Histoplasma capsulatum

J Carr et al. J Bacteriol. 1998 Dec.

Abstract

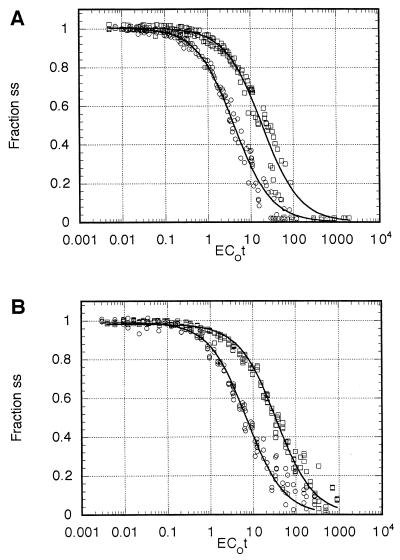
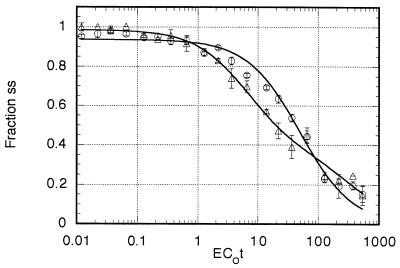
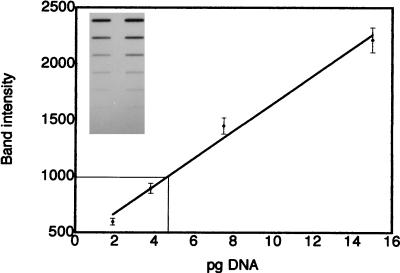
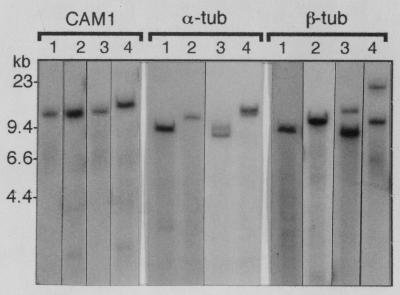
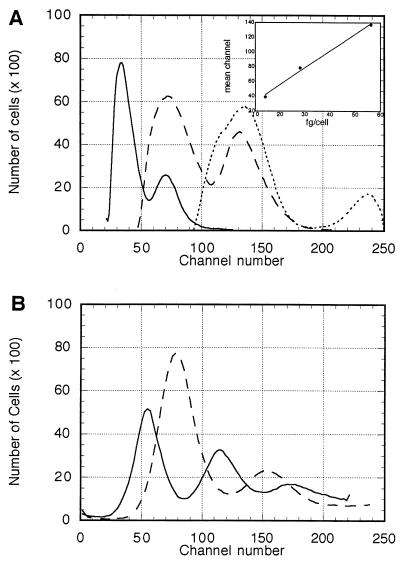
The genome size, complexity, and ploidy of the dimorphic pathogenic fungus Histoplasma capsulatum was determined by using DNA renaturation kinetics, genomic reconstruction, and flow cytometry. Nuclear DNA was isolated from two strains, G186AS and Downs, and analyzed by renaturation kinetics and genomic reconstruction with three putative single-copy genes (calmodulin, alpha-tubulin, and beta-tubulin). G186AS was found to have a genome of approximately 2.3 x 10(7) bp with less than 0.5% repetitive sequences. The Downs strain, however, was found to have a genome approximately 40% larger with more than 16 times more repetitive DNA. The Downs genome was determined to be 3.2 x 10(7) bp with approximately 8% repetitive DNA. To determine ploidy, the DNA mass per cell measured by flow cytometry was compared with the 1n genome estimate to yield a DNA index (DNA per cell/1n genome size). Strain G186AS was found to have a DNA index of 0.96, and Downs had a DNA index of 0.94, indicating that both strains are haploid. Genomic reconstruction and Southern blot data obtained with alpha- and beta-tubulin probes indicated that some genetic duplication has occurred in the Downs strain, which may be aneuploid or partially diploid.


Figures

FIG. 1
FIG. 1
Renaturation kinetics. Data shown represent the computer model best-fitted composite of three independent experiments for each curve for (A) G186AS DNA and (B) Downs DNA. Circles, E. coli DNA; squares, H. capsulatum DNA. ss, ssDNA.
FIG. 2
FIG. 2
Minicot renaturation kinetics. Data shown represent the computer model best-fitted curve. Circles, G186AS DNA; triangles, Downs DNA. Each error bar shows the standard deviation of triplicate measurements.
FIG. 3
FIG. 3
Genomic reconstruction. Inset photo shows a representative autoradiograph of G186AS DNA and calmodulin probe. The lane on the left shows twofold serial dilutions of genomic DNA starting with 400 ng. The lane on the right shows twofold serial dilutions of H. capsulatum calmodulin probe starting with 15 pg. The nitrocellulose blot was probed with radiolabeled H. capsulatum calmodulin probe. The graph depicts a standard curve of relative band intensity plotted against the amount of calmodulin (inset, lane 2). Each bar shows the standard deviation of triplicate experiments. As an example, the thin line represents the intensity of the 100-ng genomic band and yields an estimate of 4.7 pg of calmodulin target per 100 ng of genomic DNA.
FIG. 4
FIG. 4
Southern blot of G186AS and Downs genomic DNA. Genomic DNA from strain G186AS and Downs was cut to completion with several six-base-recognition restriction enzymes, separated on a 0.7% agarose gel and transferred to a nylon membrane. The blot was probed with the radiolabeled fragments of CAM1, α-tub, and β-tub used for genomic reconstruction experiments. For CAM1, α-tub, and β-tub probes, lanes 1 and 2 contain G186AS DNA and lanes 3 and 4 contain Downs DNA. For CAM1, lanes 1 and 3, HpaI; lanes 2 and 4, SalI. For α-tub probe, lanes 1 and 3, EcoRI; lanes 2 and 4, HindIII. Although difficult to see on this composite figure, the band seen in lane 4 is a closely spaced doublet. For β-tub probe, lanes 1 and 3, HindIII; lanes 2 and 4, HpaI.
FIG. 5
FIG. 5
Flow cytometry results for (A) S. cerevisiae and (B) H. capsulatum G186AS (solid line) and Downs (dashed line). In panel A, the number of cells is plotted against channel number (fluorescence intensity) for S. cerevisiae. Solid line, 1n; dashed line, 2n; dotted line, 4n. Inset graph shows a typical standard curve relating channel number to theoretical nuclear DNA mass per cell.

Similar articles

Cited by

References

    1. Ausubel F M, Brent R, Kingston R E, Moore D D, Seidman J G, Smith J A, Struhl K. Current protocols in molecular biology. New York, N.Y: John Wiley & Sons; 1993.
    1. Bawdon R E, Garrison R G, Fina L R. Deoxyribonucleic acid base composition of the yeastlike and mycelial phases of Histoplasma capsulatum and Blastomyces dermatitidis. J Bacteriol. 1972;111:593–596. - PMC - PubMed
    1. Berliner M D. Primary subcultures of Histoplasma capsulatum: I. macro- and micromorphology of the mycelial phase. Sabouraudia. 1968;6:111–118. - PubMed
    1. Britten R J, Graham D E, Neufeld B R. Analysis of repeating DNA sequences by reassociation. Methods Enzymol. 1974;29:363–418. - PubMed
    1. Dressler L G, Seame R L C, Owens M A, Clark G M, McGuire W L. DNA flow cytometry and prognostic factors in 1331 frozen breast cancer specimens. Cancer. 1988;61:420–427. - PubMed

Publication types

LinkOut - more resources