. 1998 Dec 14;143(6):1415-25.
doi: 10.1083/jcb.143.6.1415.

Spatial and temporal dynamics of DNA replication sites in mammalian cells

Affiliations

Spatial and temporal dynamics of DNA replication sites in mammalian cells

H Ma et al. J Cell Biol. .

Abstract

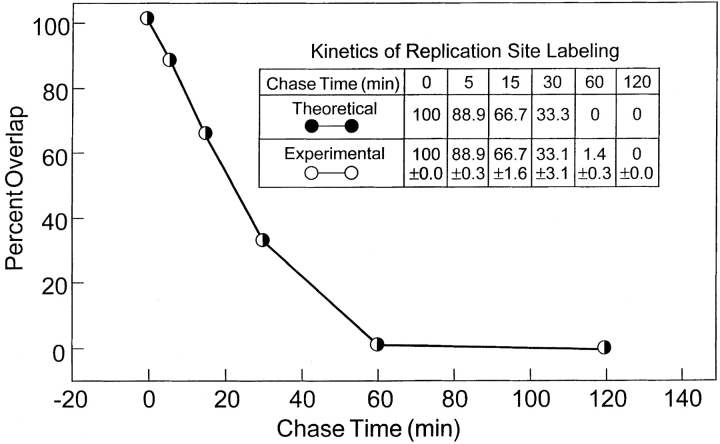
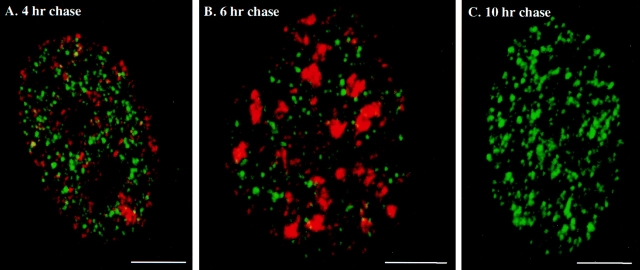
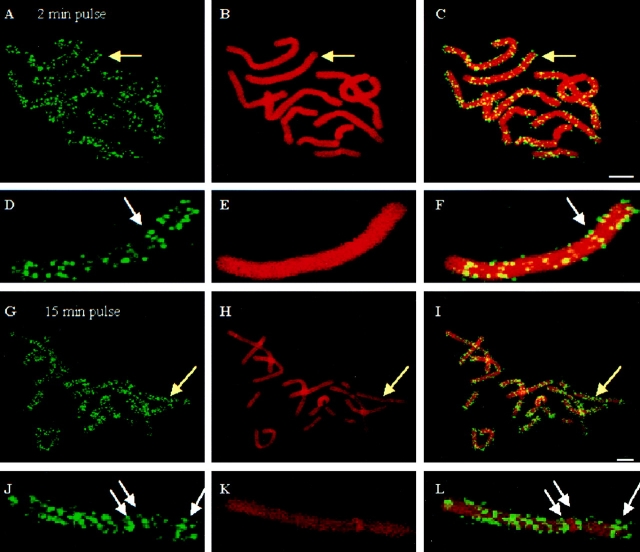
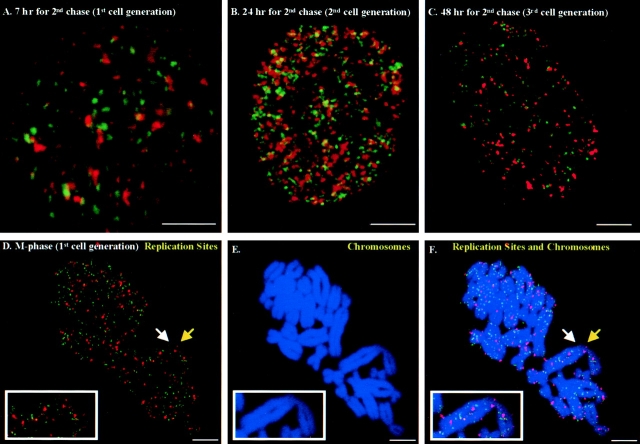
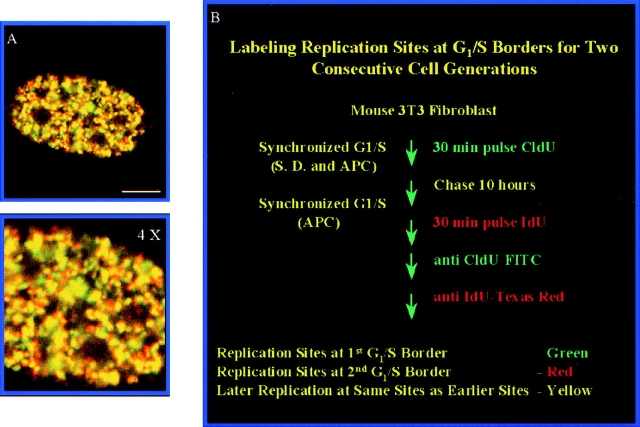
Fluorescence microscopic analysis of newly replicated DNA has revealed discrete granular sites of replication (RS). The average size and number of replication sites from early to mid S-phase suggest that each RS contains numerous replicons clustered together. We are using fluorescence laser scanning confocal microscopy in conjunction with multidimensional image analysis to gain more precise information about RS and their spatial-temporal dynamics. Using a newly improved imaging segmentation program, we report an average of approximately 1,100 RS after a 5-min pulse labeling of 3T3 mouse fibroblast cells in early S-phase. Pulse-chase-pulse double labeling experiments reveal that RS take approximately 45 min to complete replication. Appropriate calculations suggest that each RS contains an average of 1 mbp of DNA or approximately 6 average-sized replicons. Double pulse-double chase experiments demonstrate that the DNA sequences replicated at individual RS are precisely maintained temporally and spatially as the cell progresses through the cell cycle and into subsequent generations. By labeling replicated DNA at the G1/S borders for two consecutive cell generations, we show that the DNA synthesized at early S-phase is replicated at the same time and sites in the next round of replication.


Figures

Figure 1
Figure 1
Computer image analysis of individual replication sites. Replication sites were single labeled for 5 min with BrdU in unsynchronized 3T3 fibroblast cells. (A) Confocal image of replication sites in 3T3 cells in a typical 0.5-μm midplane section. (B) Contours of replication sites in the optical section shown in A after the spot based segmentation method. 495 RS were counted. (C) Contours of replication sites for A using the threshold based segmentation method. 189 RS were counted. Yellow arrow indicates one cluster of weak RS that were imaged well in B but missed in C. Yellow arrowheads indicate closely spaced RS that were imaged as individual RS in B, but grouped into a single contour in C. Bar, 5 μm.
Figure 2
Figure 2
Quantitative image analysis of replication sites. (A) Volumes and labeling intensities of RS after two 30-min pulses. (B) Distribution of RS volumes after two 30-min pulses. Over 12,000 individual sites were measured for each pulse time.
Figure 3
Figure 3
Double labeling experiments in early S-phase. Replication sites in synchronized 3T3 fibroblasts were first labeled for 2 min with CldU (FITC secondary antibody, green sites), chased for 0–60 min and, pulsed again for 5 min with IdU (Texas red secondary antibody, red sites). (A) Simultaneously pulsed; chased for (B) 5 min; (C) 15 min; (D) 30 min; (E) 1 h; (F) 2 h. Bars, 5 μm.
Figure 4
Figure 4
Kinetics of replication sites. The yellow RS and green RS were counted after chases from 0–120 min (>10,000 RS were counted for each chase time). The x axis indicates the chase time between the early and later RS. The y axis indicates the percentage overlap and is defined as the percentage of yellow RS (overlap of early and later RS labeling) compared with the yellow plus green (early S-phase labeling) sites. A theoretical decay chase curve based on a 45-min labeling time for a RS completely coincides with the experimental curve. Individual values ± SEM are shown in the insert.
Figure 5
Figure 5
Double labeling experiments in early S-phase versus later S-phase and the G2-phase. Replication sites in synchronized 3T3 fibroblasts were first labeled for 2 min with CldU (FITC secondary antibody, green sites), chased for 4–10 h and pulsed again for 5 min with IdU (Texas red secondary antibody, red sites). (A) 4-h chase (mid S-phase, type II for red RS); (B) 6-h chase (late S-phase, type III for red RS); (C) 10-h chase (G2-phase, there are no red RS). Bars, 5 μm.
Figure 6
Figure 6
Analysis of early S-phase RS in mitotic chromosomes. Replication sites in synchronized kangaroo kidney PtK1 were labeled with BrdU (FITC secondary antibody, green sites) for 2 min (A–F) or 15 min (G–L), and chased for 12 h (M-phase). (A, D, G, and J) Replication sites (green probe); (B, E, H, and K) chromosomes were counterstained with PI (red); (C, F, I, and L) merged images of replication sites (green) and chromosomes (red). (D–F) are displayed at 8× higher magnification as compared with the metaphase spreads (A–C). (J–L) are displayed at 10× higher magnification as compared with the metaphase spreads (G–I). White arrows indicate replication sites forming a chromosome band structure. Bars, 5 μm.
Figure 7
Figure 7
Double pulse–double chase experiments. Replication sites in synchronized mouse 3T3 fibroblasts were first labeled for 2 min with CldU (FITC secondary antibody, green sites), chased for 2 h, and then pulsed again for 5 min with IdU (Texas red secondary antibody, red sites). The cells were then chased a second time for (A) 7 h (late S- or G2-phase); (B) 24 h (2nd cell generation); (C) 48 h (3rd cell generation); or (D–F) 12 h (M-phase). (D) Replication sites (green for early replication sites and pseudocolor red for later replication sites); (E) Chromosomes were counterstained with PI, and pseudocolored to blue. The secondary antibody for the IdU labeling was Cy-5 conjugated and pseudocolored to red. (F) Merged image of replication sites and chromosomes. One chromosome is enlarged 4× and indicated by the white boxed window. White and yellow arrows indicate replication sites forming chromosome band structures. Bars, 5 μm.
Figure 8
Figure 8
Labeling replication sites at early S-phase for two consecutive cell generations. Replication sites in synchronized mouse 3T3 fibroblasts were first labeled for 30 min with CldU (FITC secondary antibody, green sites) at the 1st G1/S border, chased, and blocked at the 2nd G1/S border, and then pulsed again for 30 min with IdU (Texas red secondary antibody, red sites). (A) Original image (yellow replication sites mean DNA replicated at the second G1/S border occurs at same site as at the first G1/S border); (B) 4× enlargement of original replication sites; (C) Protocol for labeling replication sites at the G1/S borders for two consecutive cell generations. APC stands for aphidicolin. Bar, 5 μm.

Similar articles

Cited by

References

    1. Aten JA, Bakker PJM, Stap J, Boschman GA, Veenhof CHN. DNA double labeling with IdUrd and CldUrd for spatial and temporal analysis of cell proliferation and DNA replication. Histochem J. 1992;24:251–259. - PubMed
    1. Belmont AS, Braunfeld MB, Sedat JW, Agard DA. Large-scale chromatin structural domains within mitotic and interphase chromosomes in vivo and in vitro. Chromosoma. 1989;98:129–143. - PubMed
    1. Berezney, R. 1984. Organization and functions of the nuclear matrix. In chromosomal nonhistone proteins. L.S. Hnilica, editor. CRC Press Inc., Boca Raton, FL. 4:119–180.
    1. Berezney R. Visualizing DNA replication sites in the cell nucleus. Semin Cell Biol. 1991;2:103–115. - PubMed
    1. Berezney R, Buchholtz LA. Dynamic association of replicating DNA fragments with the nuclear matrix of regenerating liver. Exp Cell Res. 1981;132:1–13. - PubMed

Publication types