. 1998 Dec 14;143(6):1505-21.
doi: 10.1083/jcb.143.6.1505.

Recycling of golgi-resident glycosyltransferases through the ER reveals a novel pathway and provides an explanation for nocodazole-induced Golgi scattering

Affiliations

Recycling of golgi-resident glycosyltransferases through the ER reveals a novel pathway and provides an explanation for nocodazole-induced Golgi scattering

B Storrie et al. J Cell Biol. .

Abstract

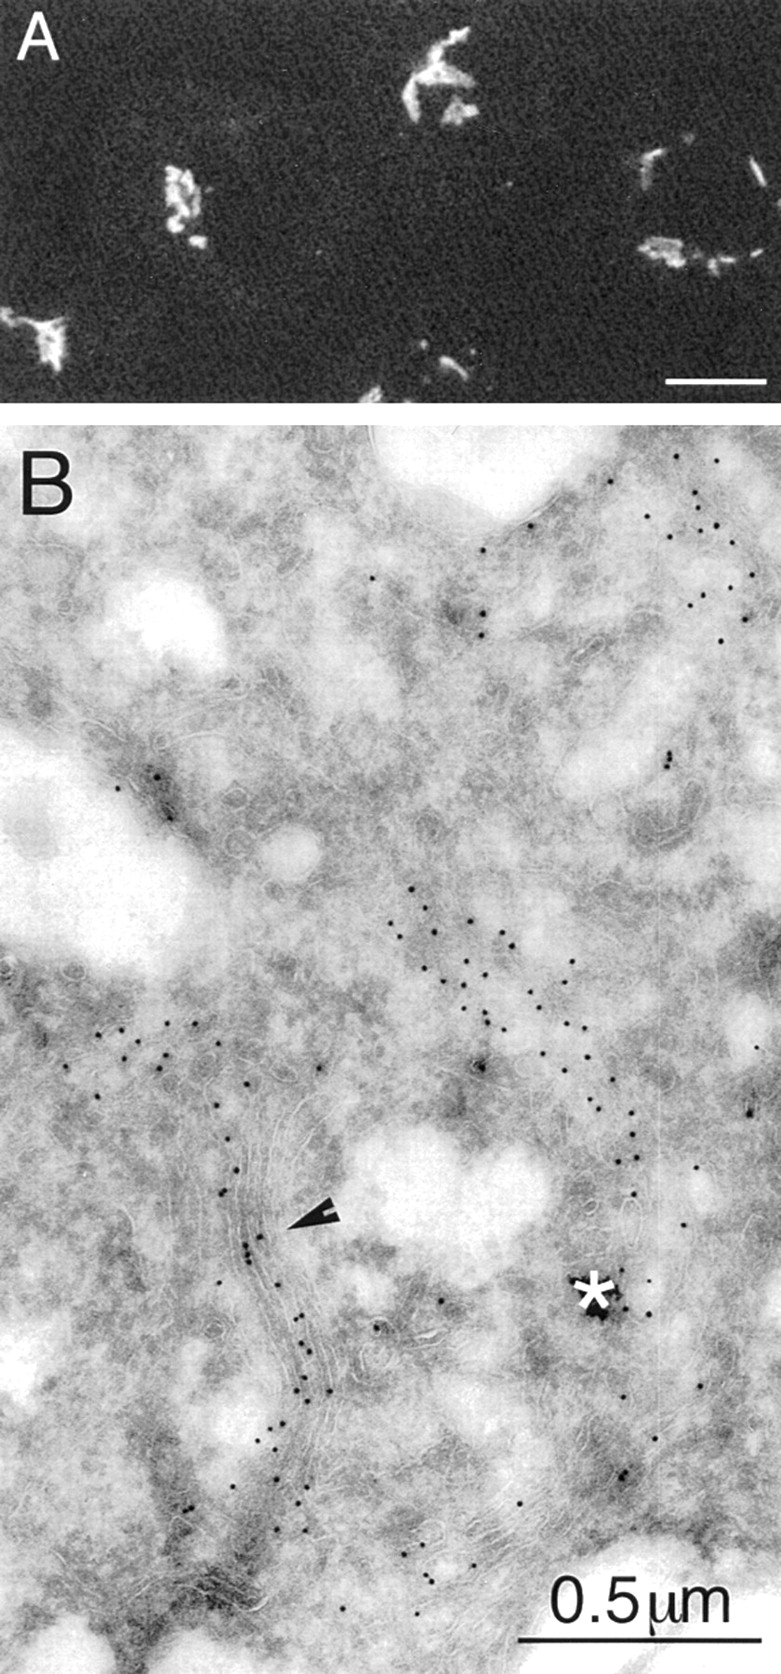
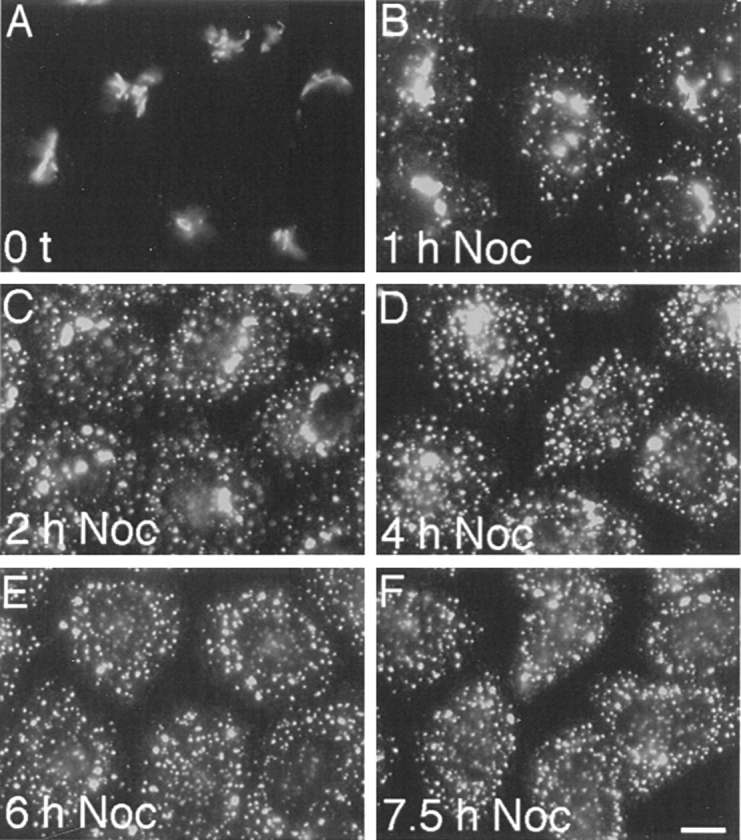
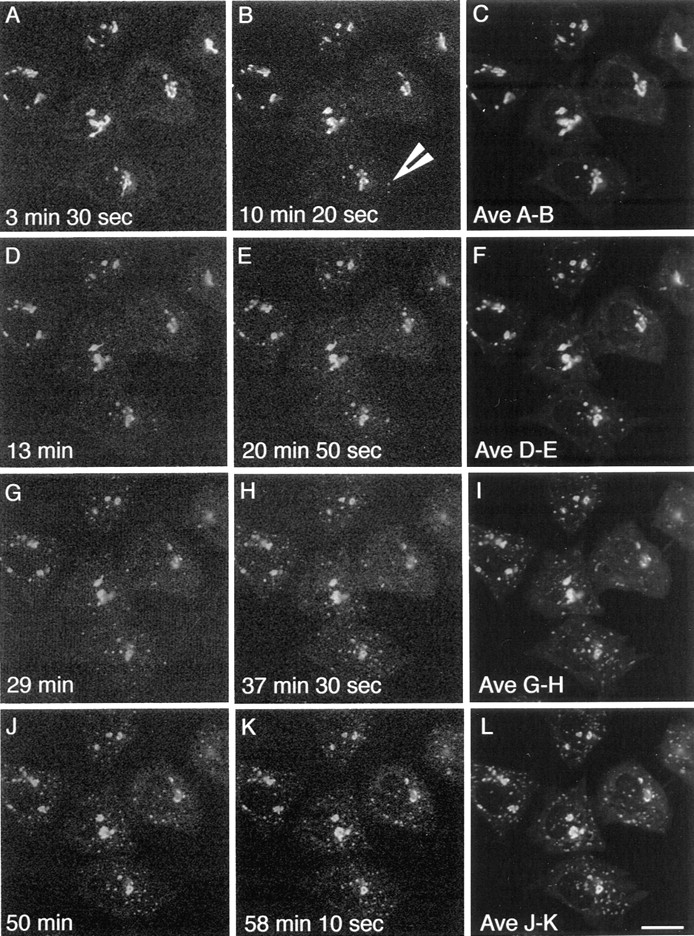
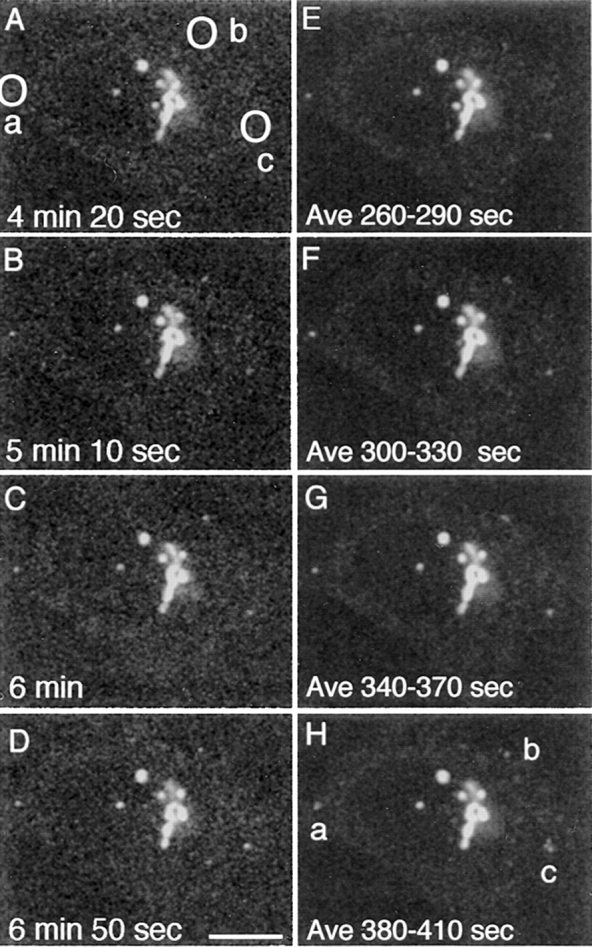
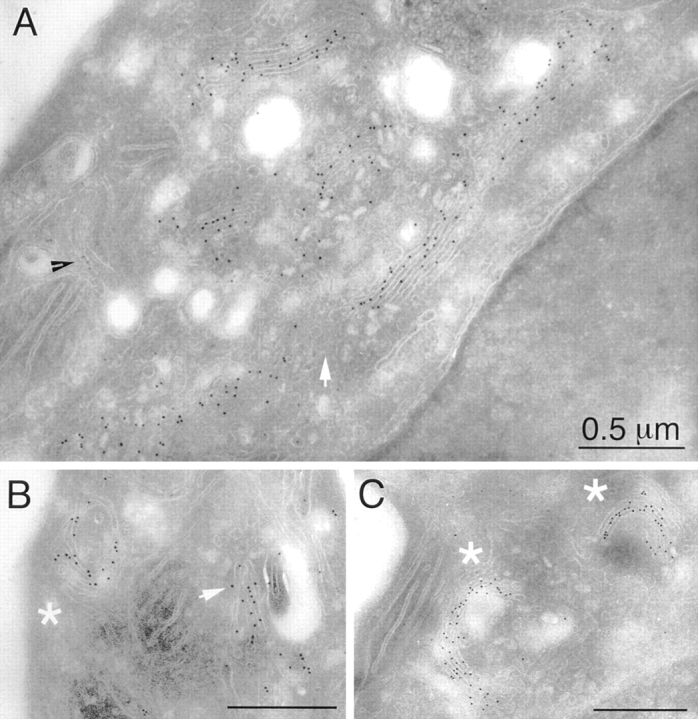
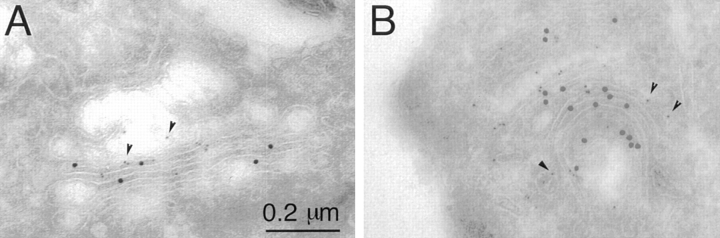
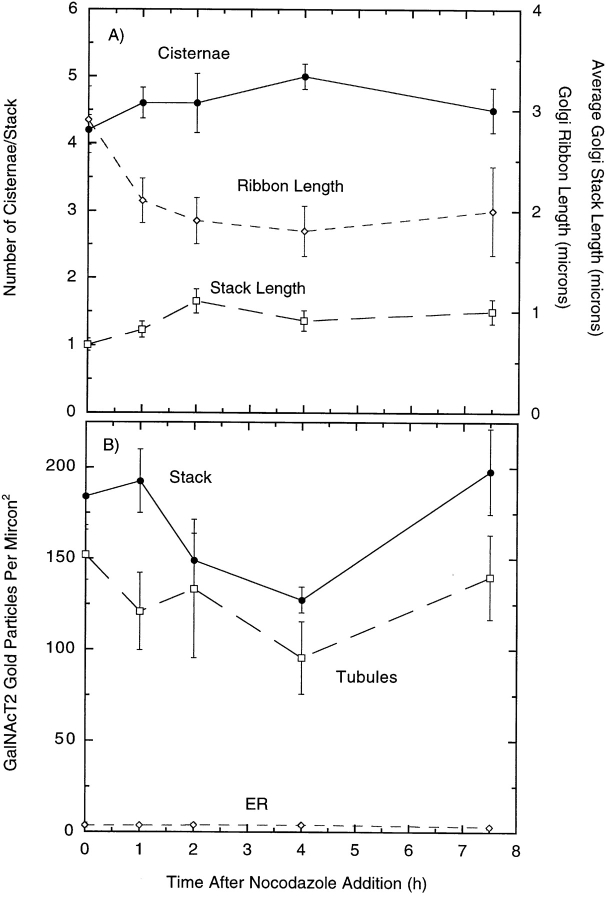
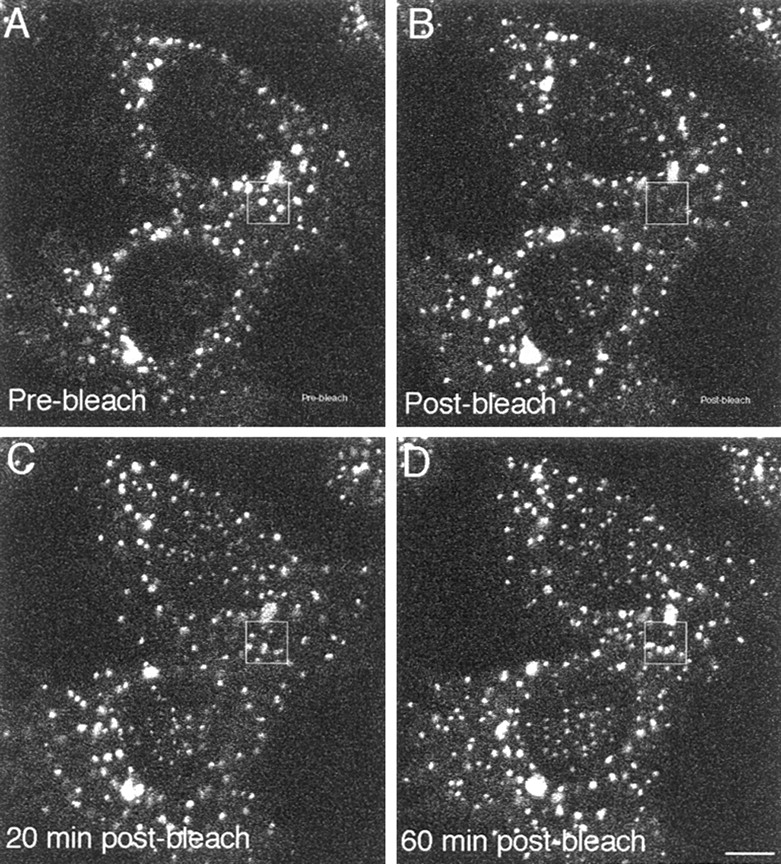
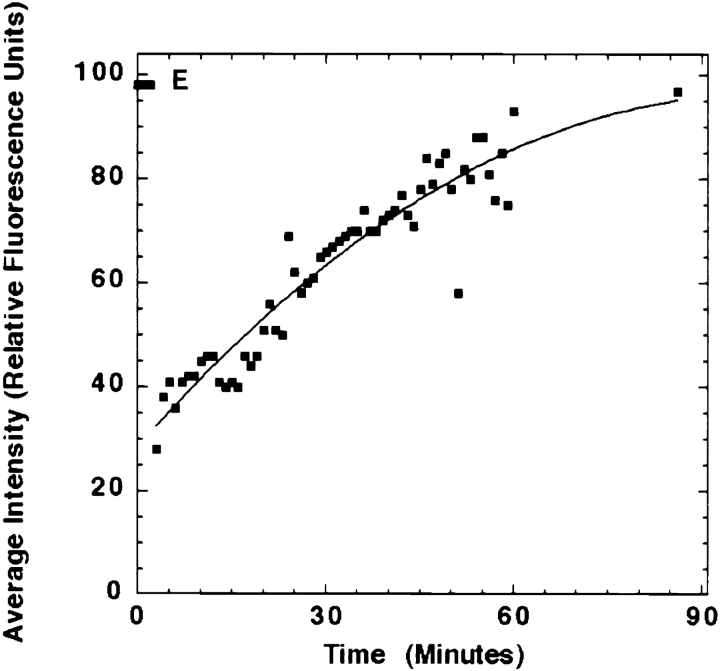
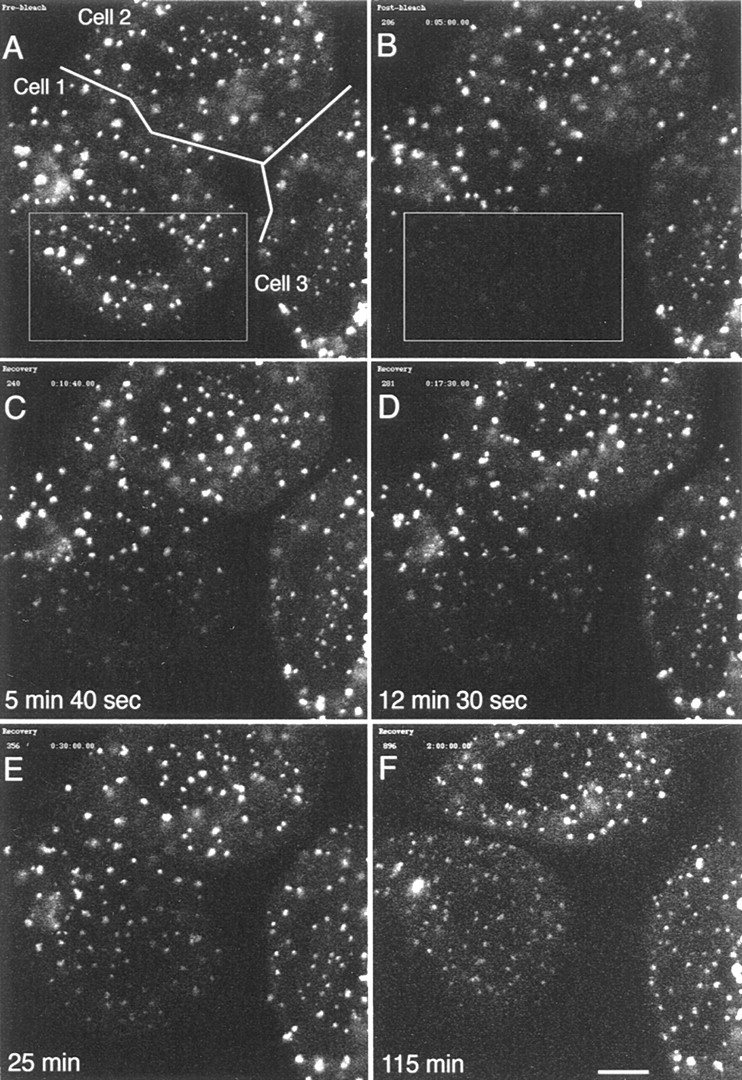
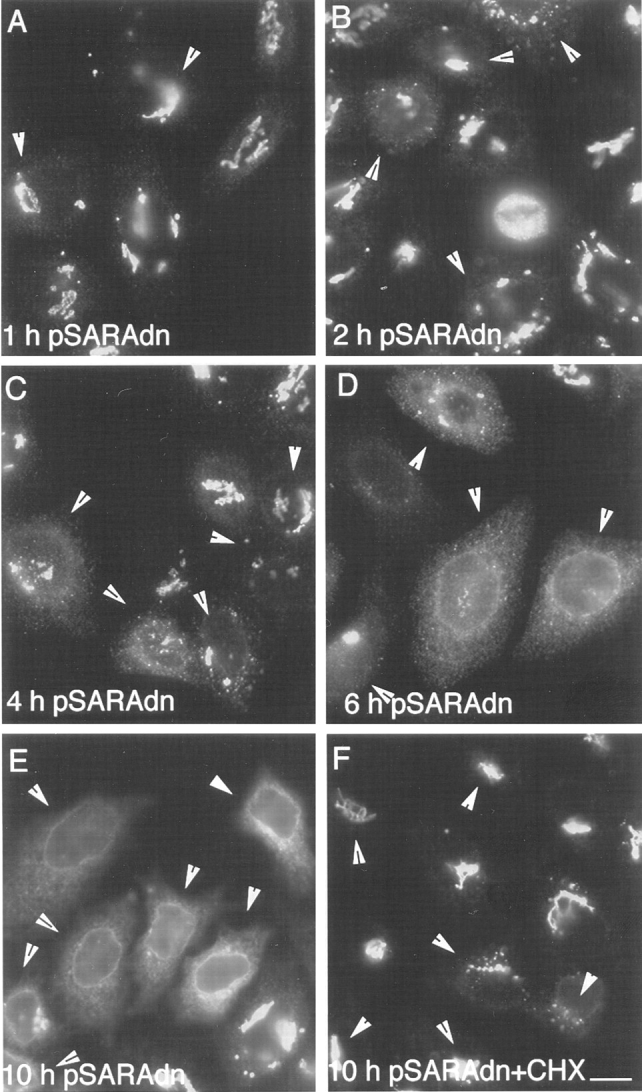
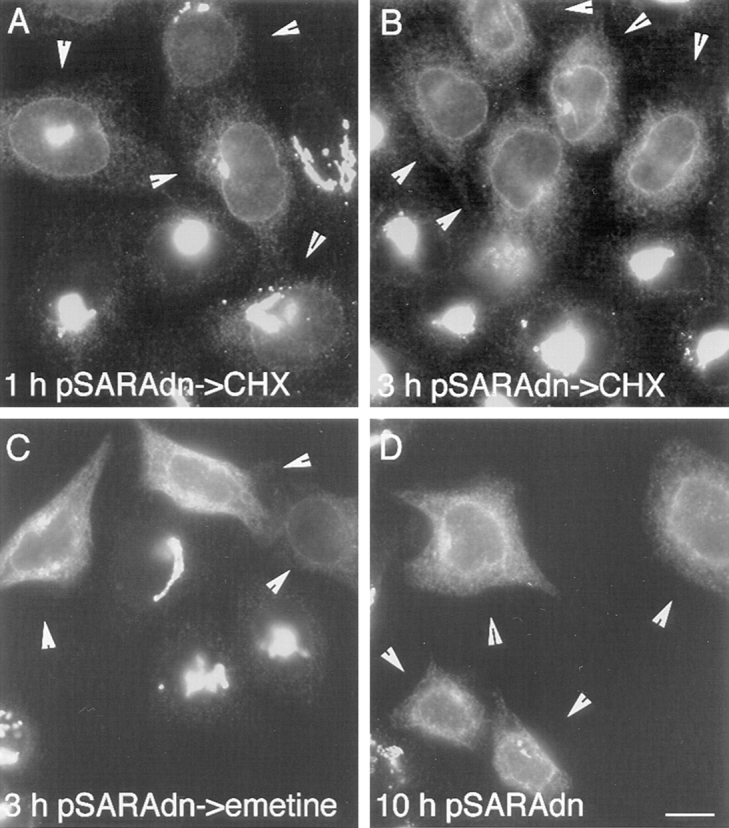
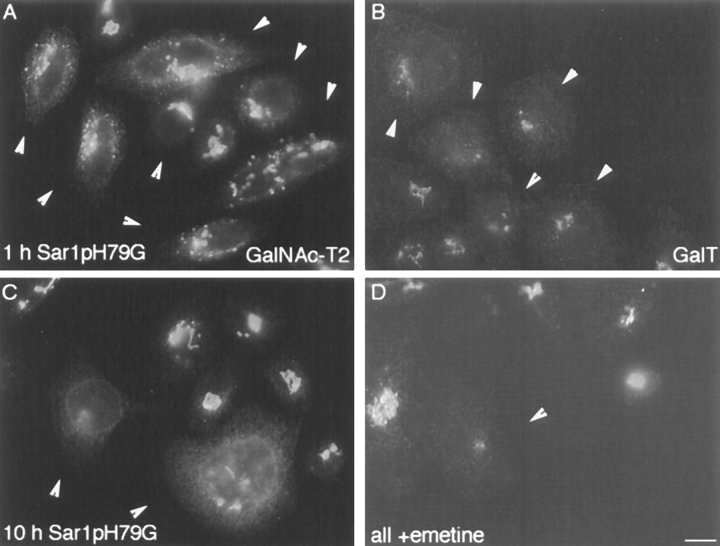
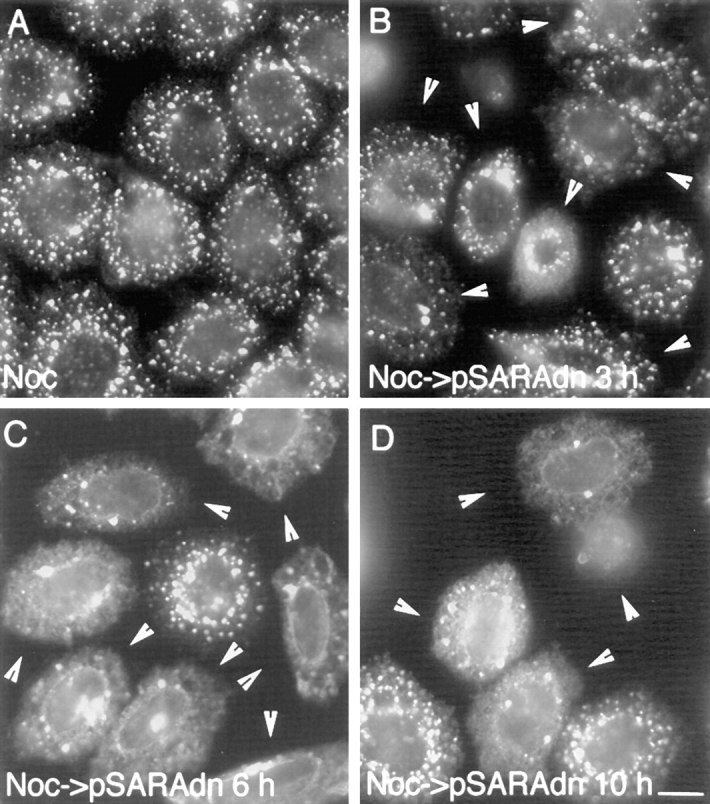
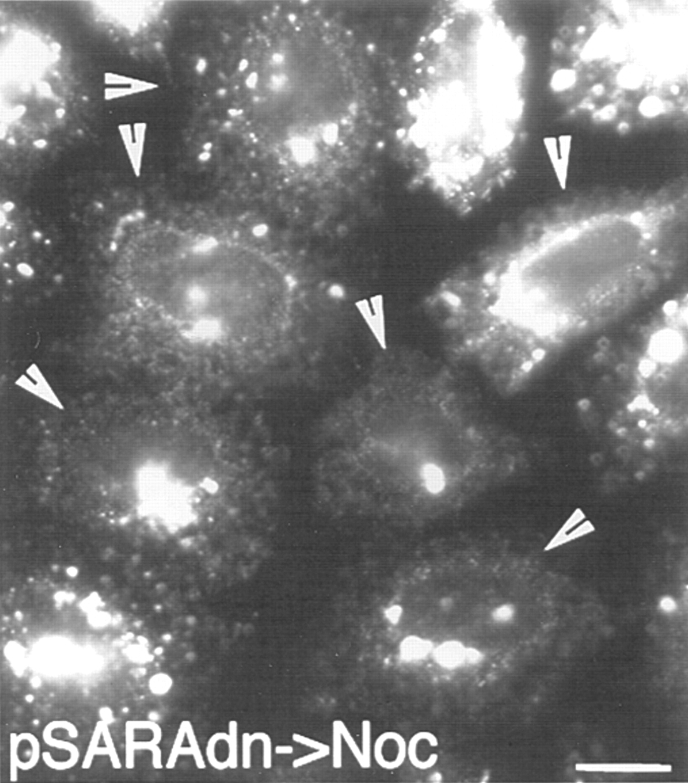
During microtubule depolymerization, the central, juxtanuclear Golgi apparatus scatters to multiple peripheral sites. We have tested here whether such scattering is due to a fragmentation process and subsequent outward tracking of Golgi units or if peripheral Golgi elements reform through a novel recycling pathway. To mark the Golgi in HeLa cells, we stably expressed the Golgi stack enzyme N-acetylgalactosaminyltransferase-2 (GalNAc-T2) fused to the green fluorescent protein (GFP) or to an 11-amino acid epitope, VSV-G (VSV), and the trans/TGN enzyme beta1,4-galactosyltransferase (GalT) fused to GFP. After nocodazole addition, time-lapse microscopy of GalNAc-T2-GFP and GalT-GFP revealed that scattered Golgi elements appeared abruptly and that no Golgi fragments tracked outward from the compact, juxtanuclear Golgi complex. Once formed, the scattered structures were relatively stable in fluorescence intensity for tens of minutes. During the entire process of dispersal, immunogold labeling for GalNAc-T2-VSV and GalT showed that these were continuously concentrated over stacked Golgi cisternae and tubulovesicular Golgi structures similar to untreated cells, suggesting that polarized Golgi stacks reform rapidly at scattered sites. In fluorescence recovery after photobleaching over a narrow (FRAP) or wide area (FRAP-W) experiments, peripheral Golgi stacks continuously exchanged resident proteins with each other through what appeared to be an ER intermediate. That Golgi enzymes cycle through the ER was confirmed by microinjecting the dominant-negative mutant of Sar1 (Sar1pdn) blocking ER export. Sar1pdn was either microinjected into untreated or nocodazole-treated cells in the presence of protein synthesis inhibitors. In both cases, this caused a gradual accumulation of GalNAc-T2-VSV in the ER. Few to no peripheral Golgi elements were seen in the nocodazole-treated cells microinjected with Sar1pdn. In conclusion, we have shown that Golgi-resident glycosylation enzymes recycle through the ER and that this novel pathway is the likely explanation for the nocodazole-induced Golgi scattering observed in interphase cells.


Figures

Figure 1
Figure 1
GalNAc-T2–GFP accurately marks the Golgi in vivo. GalNAc-T2–GFP was stably expressed in HeLa cells as described in Materials and Methods. (A) GalNAc-T2–GFP in live HeLa cells, confocal microscope image. The fluorescence patterns in the five cells shown are juxtanuclear and in some cases encircle the nucleus. The cells shown have a typical Golgi distribution. (B) GalNAc-T2–GFP associates with Golgi stacks and tubulovesicular elements in cryo-EM sections. GalNAc-T2–GFP is revealed by immunogold labeling (10-nm particle size) with a primary antibody directed against GFP. The gold particles are associated with stacked and tubulovesicular elements of a long Golgi ribbon. The black arrowhead points to an example where the section passes perpendicular to a Golgi stack. The asterisk indicates a tubulovesicular region within the Golgi ribbon. Bar in A, 20 μm.
Figure 2
Figure 2
Long-term scattering kinetics of GalNAc-T2 in response to nocodazole-induced microtubule depolymerization. HeLa cells stably transfected with GalNAc-T2–VSV were incubated with nocodazole for the times indicated in the figure. Coverslip cultures were fixed with methanol and then processed for immunofluorescence using affinity-purified rabbit anti–VSV antibodies and Cy3-conjugated anti–rabbit secondary antibodies. Bar, 10 μm.
Figure 3
Figure 3
With nocodazole addition, GalNAc-T2–GFP appears at scattered sites with no net outward movement in live cells. HeLa cells stably expressing GalNAc-T2–GFP were incubated with 20 μM nocodazole for the times indicated. Six cells are shown. Unaveraged confocal scans were taken every 10 s for 1 h after nocodazole addition. Four different periods spanning the time course are shown (A–C, D–F, G–I, and J–L). The images in the first column (A, D, G, and J) are the first time point in the period, the images in the second column (B, E, H, and K) are the last time point in the period, and the images in the third column (C, F, I, and L) are an average of all time points from the first through the last in the period, inclusive. Peripheral fluorescent patches appear faintly, accumulate fluorescence, and then remain stable in intensity and position. The net number of peripheral patches in a cell increases gradually with time. The averaged frames (C, F, I, and L) reveal no net directional movement of fluorescent patches. Bar, 20 μm.
Figure 4
Figure 4
Formation of individual peripheral patches induced by nocodazole treatment. A brief, early time interval was selected from the time-lapse experiment shown in Fig. 3. The abrupt appearance of three peripheral fluorescent patches (marked as a–c, in H) is shown over a 2.5-min period. A–D are individual confocal frames at the indicated time points after nocodazole addition. E–H are frame averages over the indicated time intervals in seconds. The circled areas in A (a–c) will be sites of subsequent fluorescent patch formation. Individual patches appear abruptly (compare A and B). At first they appear faint (B), but they then accumulate fluorescence (compare B–D). The averaged frames indicate no net outward directional movement of individual patches from the cell center, although they do oscillate within a small area defined by the smeared regions in the averaged panels (F–H). Bar, 10 μm.
Figure 5
Figure 5
Immunogold localization of GalNAc-T2–VSV shows that the Golgi maintains its stack structure upon nocodazole treatment. HeLa cells stably transfected with GalNAc-T2–VSV were either fixed immediately (A) or incubated in the presence of nocodazole for 2 h (B) or 7.5 h (C). Cryosections were double labeled for GalNAc-T2–VSV (Golgi, 10-nm gold) and PDI (ER, 5-nm gold). As can be seen in A, GalNAc-T2–VSV enriched structures in control cells consist of a mix of stacked Golgi cisternae and tubulovesicular structures. Continuous segments of stacked cisternae and tubulovesicular structures are termed a Golgi ribbon. The white arrow points to an example of an interruption that divides an otherwise continuous Golgi ribbon into two segments. The black arrowhead points to PDI in an ER element. In nocodazole-treated cells (B and C), GalNAc-T2–VSV– enriched structures consist either of linear stacks of Golgi cisternae (B, white arrowhead) and associated tubulovesicular structures or stacks and associated tubulovesicular structures that curve back on themselves to form onions (asterisks, B and C).
Figure 6
Figure 6
Peripheral Golgi structures are polarized. Both linear (A) and onion-shaped Golgi stacks (B) in nocodazole-treated cells show a polarized distribution of GalT. HeLa cells stably expressing GalNAc-T2–VSV were incubated with nocodazole for 7.5 h. Cells were then fixed and processed for cryosectioning and immunolabeling with 15-nm gold (GalNAc-T2–VSV) and endogenous GalT (5-nm gold). The black arrowheads point to examples of GalT (5-nm gold) labeling to one side of the Golgi stack. In sections cut perpendicular to Golgi stacks, GalNAc-T2–VSV distributes across much of the stack while GalT is found predominantly to one side.
Figure 7
Figure 7
Stacks are maintained, and GalNAc-T2–VSV labeling remains concentrated in cisternae as the Golgi scatters. 15 different images were quantified for each time point. The number of cisternae per stack includes both flattened and curved stacks (A). Golgi ribbon length decreases slightly (see Figs. 1 and 5 for visual examples of Golgi ribbons), and stack length actually increases (A). GalNAc-T2–VSV labeling distribution over Golgi-like structures dropped transiently during Golgi scattering (B). Only a small increase in GalNAc-T2 labeling density over the ER was observed consistent with Golgi proteins concentrating during episodic assembly events into Golgi stacks. Error bars are the standard error of the mean.
Figure 8
Figure 8
FRAP experiments reveal that resident Golgi proteins are exchanged slowly between peripheral Golgi stacks. Two cells are shown in the center of the field and a portion of a third in the upper right hand corner. Cells were treated with nocodazole for 6 h to scatter the Golgi. The boxed 4 × 4 μm area in the upper center cell was photobleached (B). The cells were observed at 10-s intervals for 90 min after the bleach. As shown in C and D, photorecovery of the peripheral bleached patches was gradual with recovery at the same rate across the entire boxed area. Fluorescence recovery is quantified in E as described in Materials and Methods. Zero time is immediately after the bleach (B). Bar, 5.0 μm.
Figure 8
Figure 8
FRAP experiments reveal that resident Golgi proteins are exchanged slowly between peripheral Golgi stacks. Two cells are shown in the center of the field and a portion of a third in the upper right hand corner. Cells were treated with nocodazole for 6 h to scatter the Golgi. The boxed 4 × 4 μm area in the upper center cell was photobleached (B). The cells were observed at 10-s intervals for 90 min after the bleach. As shown in C and D, photorecovery of the peripheral bleached patches was gradual with recovery at the same rate across the entire boxed area. Fluorescence recovery is quantified in E as described in Materials and Methods. Zero time is immediately after the bleach (B). Bar, 5.0 μm.
Figure 9
Figure 9
FRAP-W experiments reveal that the entire population of peripheral Golgi stacks are active in protein exchange. Three cells are shown. Cells were treated with nocodazole for 6 h to scatter the Golgi. The boxed area covering cell 1 (A, ∼50% of cell area) was photobleached (B). The cells were observed at 10-s intervals for 2 h after the bleach. As shown in C–F, photorecovery of the peripheral bleached patches was gradual. Correspondingly, fluorescence was lost from the nonbleached fluorescent patches. Zero time is immediately after the bleach (B). Bar, 7.5 μm.
Figure 10
Figure 10
Microinjection of pSar1pdnCMUIV plasmids resulted in the gradual loss of juxtanuclear Golgi staining for GalNAc-T2– VSV and a concomitant accumulation in the ER. Cells were microinjected with plasmid as described in Materials and Methods. Cascade blue bovine serum albumin was used as a coinjection marker. Microinjected cells are indicated by arrowheads. Cells were fixed at various times after injection: A, 1 h; B, 2 h; C, 4 h; D, 6 h; E, 10 h. After a lag period, as seen in A, where there is little if any effect on GalNAc-T2–VSV distribution, progressive accumulation in the ER as marked by a weblike cytoplasmic staining pattern and rim staining of the nucleus was observed. With time, most if not all juxtanuclear concentration of GalNAc-T2 staining was lost. In F, cells were microinjected with plasmid in the presence of 100 μg/ml CHX and then incubated for 10 h in the presence of drug. CHX gave almost complete inhibition of GalNAc-T2 redistribution. Bar, 10 μm.
Figure 11
Figure 11
Pulse expression of Sar1pdn was sufficient to give GalNAc-T2–VSV redistribution to the ER. Cells were microinjected as described in Materials and Methods and the legend for Fig. 10. Cells were incubated for various times after injection in the absence of protein synthesis inhibitor. (A) CHX at a concentration of 100 μg/ml was added 1 h after plasmid injection. Cells were then incubated in the presence of drug for an additional 9 h. (B) CHX was added 3 h after microinjection, and cells were incubated for an additional 7 h. (C) Emetine was added at a concentration of 5 μg/ml, and the cells were then incubated for an additional 7 h. (D) Cells were incubated in the absence of drug for 10 h after microinjection. Bar, 10 μm.
Figure 12
Figure 12
Sar1pdn induced ER accumulation of GalNAc-T2– VSV or GalT by Sar1pdn protein injection. Cells were microinjected with Sar1pdn protein in the presence of 5 μg emetine and then incubated for various times (A and B, 1 h; C and D, 10 h) in the presence of emetine. This concentration of emetine is sufficient to inhibit 99% of cellular protein synthesis. Cascade blue bovine serum albumin was used as a coinjection marker. Microinjected cells are indicated by arrowheads. In A and C, staining is for GalNAc-T2–VSV, and in B and D, staining is for GalT. Bar, 10 μm.
Figure 13
Figure 13
GalNAc-T2–VSV associated with nocodazole peripheral Golgi stacks redistributed to the ER in cells expressing Sar1pdn. Cells were preincubated with nocodazole (Noc) for 6 h before microinjection. Plasmid microinjection was as described in Materials and Methods. Cascade blue bovine serum albumin was used as a coinjection marker. Microinjected cells are indicated by arrowheads. Cells were fixed at various times after injection: B, 2 h; C, 6 h; D, 10 h. Nuclear rim staining and diffuse staining of weblike cytoplasmic fluorescence indicate ER localization. Bar, 10 μm.
Figure 14
Figure 14
Expression of Sar1pdn inhibited nocodazole-induced Golgi scattering. After microinjection, cells were incubated for 3 h before nocodazole addition. This was to allow for plasmid expression and accumulation of Sar1pdn. Plasmid microinjection was as described in Materials and Methods. Cascade blue bovine serum albumin was used as a coinjection marker. Microinjected cells are indicated by arrowheads. Cells were fixed 1 h after nocodazole addition. Bar, 10 μm.

References

    1. Aridor M, Bannykh SJ, Rowe T, Balch WE. Sequential coupling between COPII and COPI vesicle coats in endoplasmic reticulum to Golgi transport. J Cell Biol. 1995;131:875–893. - PMC - PubMed
    1. Axelrod D, Koppel DE, Schlessinger J, Elson E, Webb WW. Mobility measurement by analysis of fluorescence photobleaching recovery kinetics. Biophys J. 1976;16:1055–1069. - PMC - PubMed
    1. Burkhardt JK. The role of microtubule-based motor proteins in maintaining the structure and function of the Golgi complex. Biochim Biophys Acta. 1998;1404:113–126. - PubMed
    1. Burkhardt JK, Echeverri CJ, Nilsson T, Vallee RB. Overexpression of the dynamitin (p50) subunit of the dynactin complex disrupts dynein-dependent maintenance of membrane organelle distribution. J Cell Biol. 1997;139:469–484. - PMC - PubMed
    1. Cole NB, Sciaky N, Marotta A, Song J, Lippincott-Schwartz J. Golgi dispersal during microtubule disruption: regeneration of Golgi stacks at peripheral endoplasmic reticulum exit sites. Mol Biol Cell. 1996a;7:631–650. - PMC - PubMed

Publication types

MeSH terms

Substances