. 1998 Dec 14;143(6):1523-34.
doi: 10.1083/jcb.143.6.1523.

Two functional states of the CD11b A-domain: correlations with key features of two Mn2+-complexed crystal structures

Affiliations

Two functional states of the CD11b A-domain: correlations with key features of two Mn2+-complexed crystal structures

R Li et al. J Cell Biol. .

Abstract

In the presence of bound Mn2+, the three- dimensional structure of the ligand-binding A-domain from the integrin CR3 (CD11b/CD18) is shown to exist in the "open" conformation previously described only for a crystalline Mg2+ complex. The open conformation is distinguished from the "closed" form by the solvent exposure of F302, a direct T209-Mn2+ bond, and the presence of a glutamate side chain in the MIDAS site. Approximately 10% of wild-type CD11b A-domain is present in an "active" state (binds to activation-dependent ligands, e.g., iC3b and the mAb 7E3). In the isolated domain and in the holoreceptor, the percentage of the active form can be quantitatively increased or abolished in F302W and T209A mutants, respectively. The iC3b-binding site is located on the MIDAS face and includes conformationally sensitive residues that undergo significant shifts in the open versus closed structures. We suggest that stabilization of the open structure is independent of the nature of the metal ligand and that the open conformation may represent the physiologically active form.


Figures

Figure 1
Figure 1
The Mn2+ structure of r11bA. A and B show a close-up of the MIDAS motif in the open (this report) and closed (Lee et al., 1995a ) conformations, respectively. The Mn2+ metal ion in both forms is displayed in gray, oxygen atoms and water molecules are in red, and the protein backbone is shown schematically as a light green ribbon. C and D show a top view of r11bA structure (ribbon backbone) with the major changes in the open (C) (this report) and closed (D) Mn2+-complexed conformations. The solvent-exposed Mn2+ is shown (light green ball) surrounded by the largely buried metal coordinating residues D140, S142, S144, T209, and D242 (side chains are outlined in yellow and red). F302 and F275 are shown in light blue. The figure was built using QUANTA (Molecular Simulations Inc., Mountain View, CA). See the text for details.
Figure 2
Figure 2
Effects of A-domain mutants on CR3 surface expression and iC3b binding. (A) Histograms (mean ± SEM, n = 3) showing the relative binding of anti-CD11b mAb OKM10 to COS cells expressing mutant CR3. (B) Histograms (mean ± SEM, n = 3) showing the relative binding of iC3b to COS cells expressing CR3 mutants. (Inset) Radioautograph of a Western blot showing comparable amounts of the CD11b subunit in anti-CD18 immunoprecipitates from COS cells expressing WT or mutant CR3. No CD11b was seen in anti-CD18 immunoprecipitates from COS cells transfected with CD18 cDNA alone.
Figure 3
Figure 3
Protein movements of the iC3b-binding site in the two structures. Position of the side chains of residues involved in iC3b binding on MIDAS relative to Mn (white ball) in the open (red) and closed (yellow) structures. The residues that are also involved in NIF binding, G143, D149, E178E, and R208 (based on single or double amino acid substitutions) (Rieu et al., 1996), undergo little movement in the two structures (see also Table II).
Figure 4
Figure 4
Effects of mutations involving F302, F275, and T209 on iC3b, fibrinogen, and NIF binding to recombinant membrane-bound CR3. (A) Histograms (mean ± SEM, n = 3) showing the normal cell surface expression of the mutant CR3 on transfected COS cells, as checked by anti-CD11b mAb 903 and anti-CD18 mAb TS1/ 18. (B) Histograms (mean ± SEM, n = 4) showing the binding of mutant CR3 expressed on COS cells to iC3b and NIF. (C) Histograms (mean ± SEM, n = 3) showing the binding of WT or F302W CR3-transfected CHO cells to iC3b and fibrinogen (Fg). The surface expression levels of both WT and F302W receptors were ∼70% (data not shown).
Figure 5
Figure 5
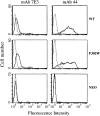
Interaction of mAb 7E3 with WT or F302W-transfected CHO cells. Expression of the activation-specific 7E3 epitope on WT, F302W, or Neo-transfected CHO cells was examined by flow cytometry. mAb 44, which recognizes the whole population of CR3, was used as a reference. Mouse IgG1 (dotted lines) was used to determine background fluorescence. The fraction of CR3 recognized by 7E3 is 5.95 ± 1.16% for WT and 14.9 ± 3.47% for F302W (n = 6).
Figure 6
Figure 6
Effects of F302W and T209A on direct binding of purified r11bA to iC3b, NIF, and mAb 7E3. (A) Histograms (mean ± SEM, n = 3) showing that equivalent amounts of WT and mutant r11bA were immobilized onto 96-well plates. (B) Histograms (mean ± SEM, n = 5) showing a selective gain of binding of F302W to iC3b but not to NIF, and a selective loss of binding of T209A to iC3b but not to NIF. (C) Histograms (mean ± SEM, n = 4) showing a gain of F302W binding to mAb 7E3 and a loss of T209A binding to this mAb.
Figure 7
Figure 7
Sensorgrams recording interactions of WT or F302W A-domains with immobilized iC3b and mAb 904. Overlay plot of sensorgrams recorded the injection of 1 μM of WT (solid lines) or F302W (dashed lines) A-domains at a flow rate of 5 μl/min for 6 min through the iC3b- (A) or mAb 904–coated (B) chips. Arrows indicate the beginning and end of injection.
Figure 8
Figure 8
Equilibrium analysis of the interaction of WT or F302W A-domains with immobilized iC3b. Concentrations ranging from 0.5 to15 μM for WT (A) and 0.5 to 12 μM for F302W (B) were injected at a flow rate of 5 μl/min for 6 min to reach equilibrium. C (for WT) and D (for F302W) show the respective saturable binding curves and Scatchard plots (insets).

Similar articles

Cited by

References

    1. Altieri DC. Occupancy of CD11b/CD18 (Mac-1) divalent ion binding site(s) induces leukocyte adhesion. J Immunol. 1991;147:1891–1896. - PubMed
    1. Altieri DC, Edgington TS. The saturable high affinity association of factor X to ADP-stimulated monocytes defines a novel function of the MAC-1 receptor. J Biol Chem. 1988;263:7007–7015. - PubMed
    1. Andrew DP, Berlin C, Honda S, Yoshino T, Hamann A, Holzmann B, Kilshaw PJ, Butcher EC. Distinct but overlapping epitopes are involved in alpha 4 beta 7-mediated adhesion to vascular cell adhesion molecule-1, mucosal addressin-1, fibronectin, and lymphocyte aggregation. J Immunol. 1994;153:3847–3861. - PubMed
    1. Arnaout MA, Todd RF, III, Dana N, Melamed J, Schlossman SF, Colten HR. Inhibition of phagocytosis of complement C3- or immunoglobulin G–coated particles and of iC3b binding by monoclonal antibodies to a monocyte-granulocyte membrane glycoprotein (Mo1) J Clin Invest. 1983;72:171–179. - PMC - PubMed
    1. Bajt ML, Loftus JC. Mutation of a ligand binding domain of β3 integrin: integral role of oxygenated residues in αIIbβ3 (GPIIb-IIIa) receptor function. J Biol Chem. 1994;269:20913–20919. - PubMed

Publication types

MeSH terms