. 1998 Dec 14;143(6):1575-89.
doi: 10.1083/jcb.143.6.1575.

Centriole disassembly in vivo and its effect on centrosome structure and function in vertebrate cells

Affiliations

Centriole disassembly in vivo and its effect on centrosome structure and function in vertebrate cells

Y Bobinnec et al. J Cell Biol. .

Abstract

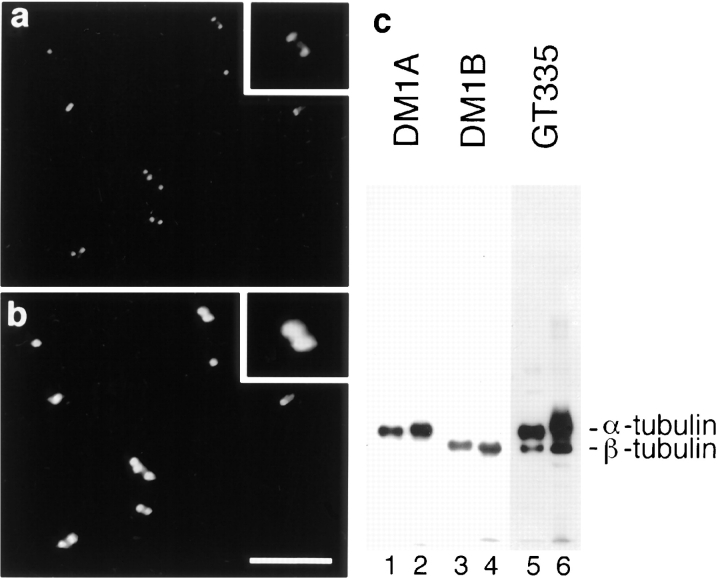
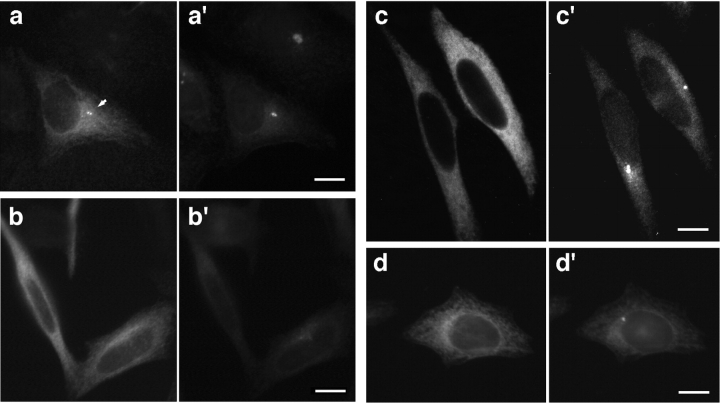
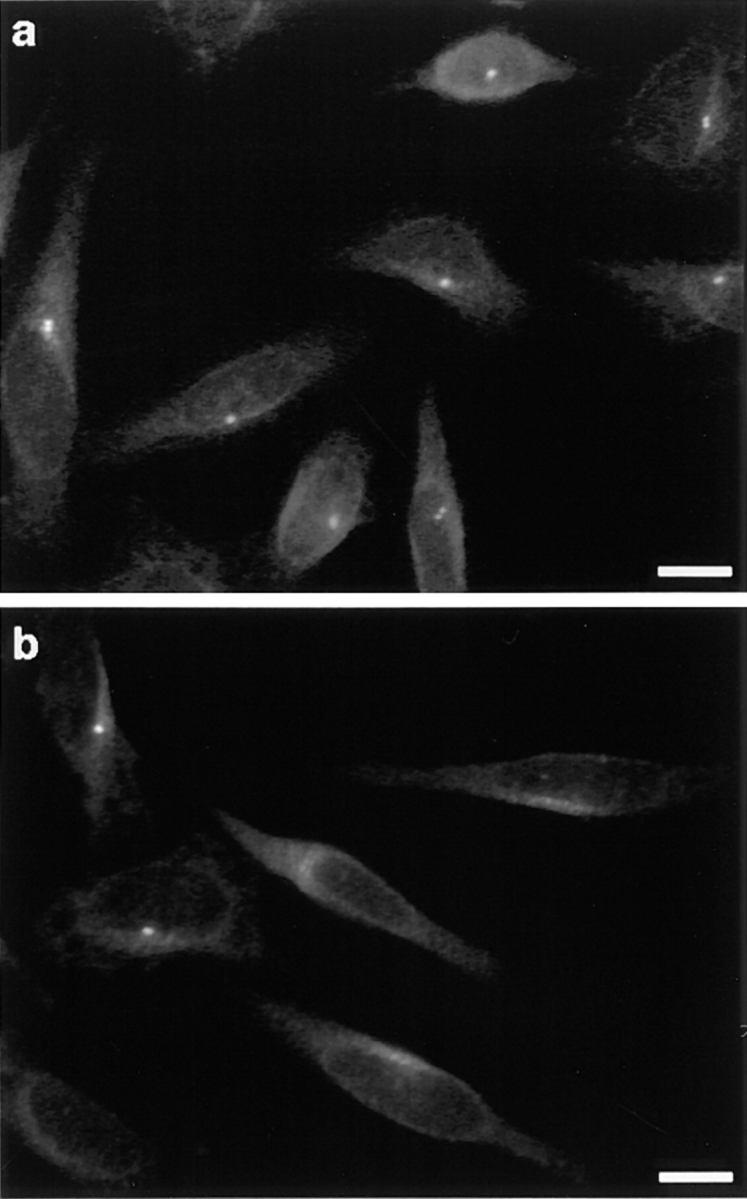
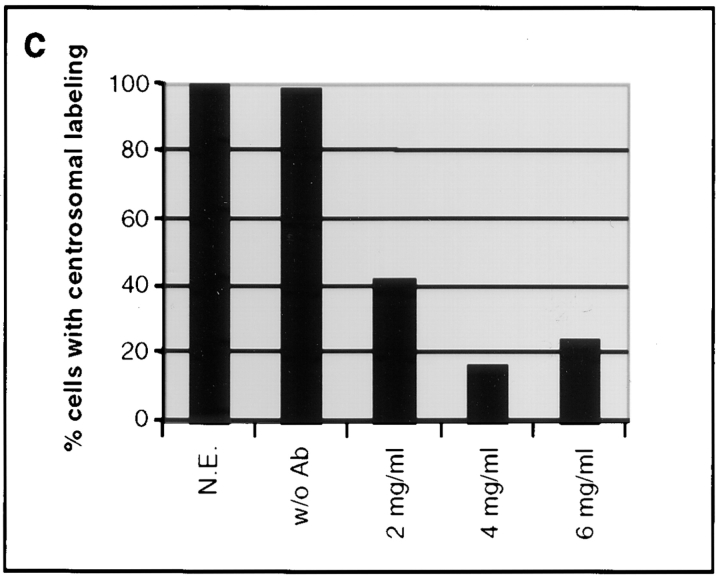
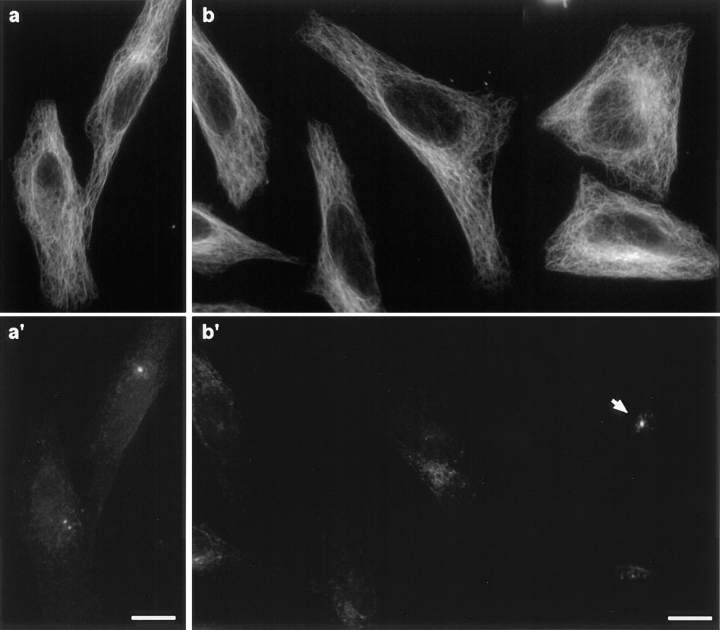
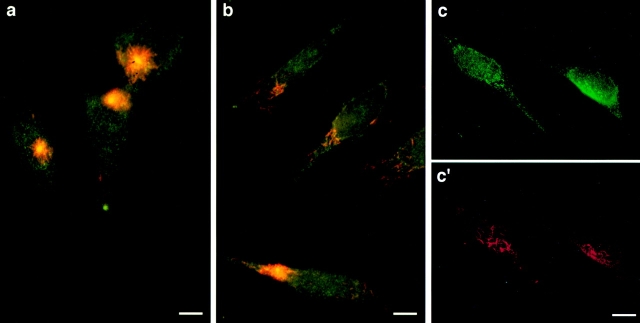
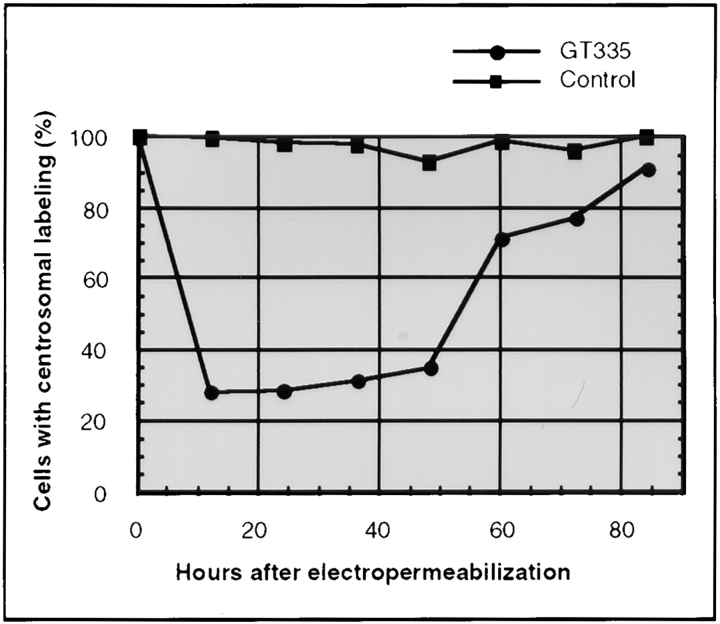
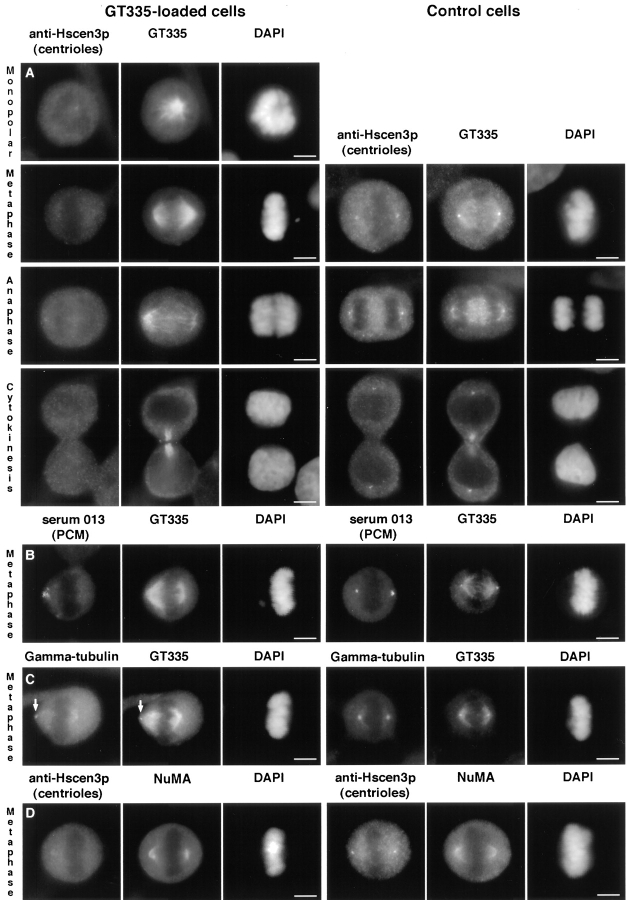
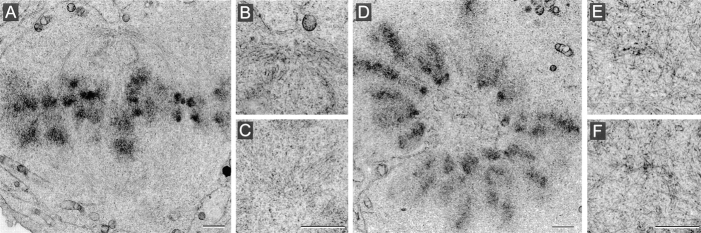
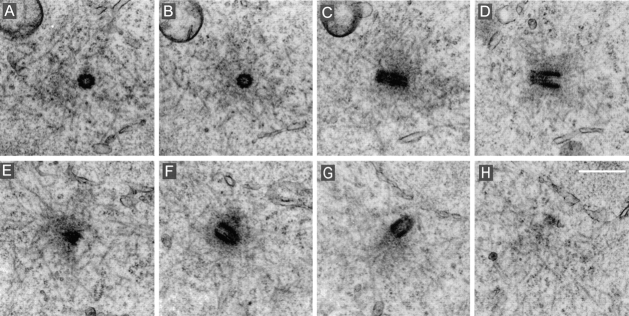
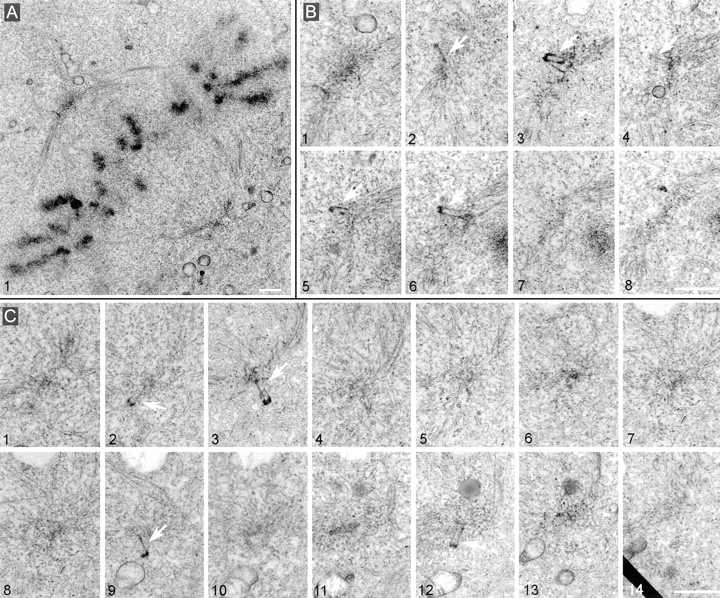
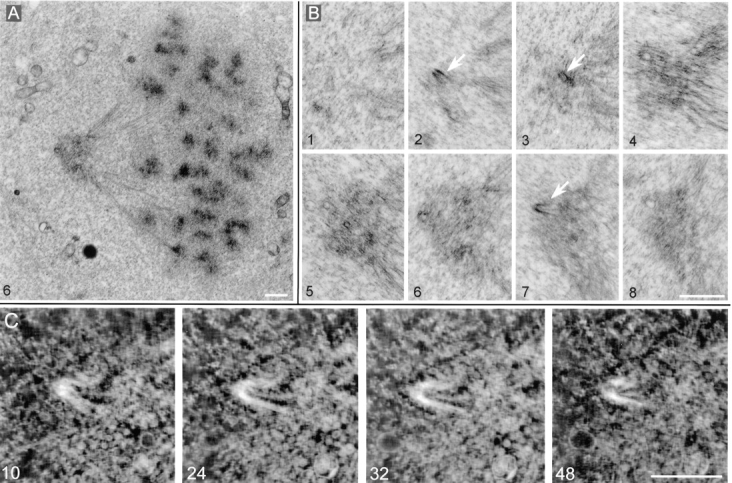
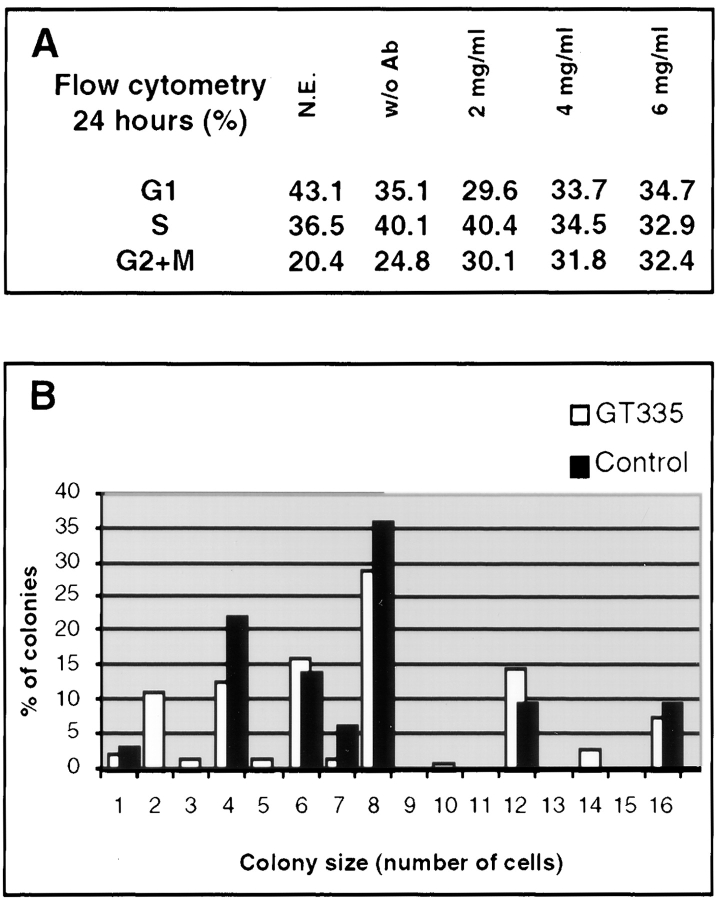
Glutamylation is the major posttranslational modification of neuronal and axonemal tubulin and is restricted predominantly to centrioles in nonneuronal cells (Bobinnec, Y., M. Moudjou, J.P. Fouquet, E. Desbruyères, B. Eddé, and M. Bornens. 1998. Cell Motil. Cytoskel. 39:223-232). To investigate a possible relationship between the exceptional stability of centriole microtubules and the compartmentalization of glutamylated isoforms, we loaded HeLa cells with the monoclonal antibody GT335, which specifically reacts with polyglutamylated tubulin. The total disappearance of the centriole pair was observed after 12 h, as judged both by immunofluorescence labeling with specific antibodies and electron microscopic observation of cells after complete thick serial sectioning. Strikingly, we also observed a scattering of the pericentriolar material (PCM) within the cytoplasm and a parallel disappearance of the centrosome as a defined organelle. However, centriole disappearance was transient, as centrioles and discrete centrosomes ultimately reappeared in the cell population. During the acentriolar period, a large proportion of monopolar half-spindles or of bipolar spindles with abnormal distribution of PCM and NuMA were observed. However, as judged by a quasinormal increase in cell number, these cells likely were not blocked in mitosis. Our results suggest that a posttranslational modification of tubulin is critical for long-term stability of centriolar microtubules. They further demonstrate that in animal cells, centrioles are instrumental in organizing centrosomal components into a structurally stable organelle.


Figures

Figure 1
Figure 1
Centriole microtubules are heavily glutamylated. Double-immunofluorescence on isolated centrosomes with the antiglutamylated tubulin antibody GT335 (a) and 013 anticentrosome antibody (b). Glutamylated centrioles were decorated as pairs of dots embedded in pericentriolar material (twofold magnification of a selected pair in inset). Glutamylated tubulin isoforms were detected in similar amounts in tubulin from brain (c, lanes 1, 3, and 5) and isolated centrosomes (lanes 2, 4, and 6). Detection of α-tubulin (lanes 1 and 2: DM1A), β-tubulin (lanes 3 and 4: DM1B), or glutamylated tubulin (lanes 5 and 6: GT335). Similar amounts of tubulin were loaded in all lanes. Bar, 10 μm.
Figure 2
Figure 2
Microinjection of GT335 immunoglobulins in HeLa cells. Cells were processed for double immunofluorescence with a secondary antibody to localize injected immunoglobulins (a–d) and with 013 anticentrosome antibody (a′–d′). 3 h after injection, GT335 IgGs were detected at the centrioles (arrow) and on cytoplasmic microtubules (a); centrosomes were also detected in the same cells (a′). No centriole or centrosome staining were visible 24 h after microinjection (b and b′). 24 h after injection of mock IgGs, control cells showed a background staining of the cytoplasm and displayed a centrosome labeling (c and c′). 24 h after injection, cells injected with antiacetylated tubulin antibody showed an intense staining of the cytoplasmic microtubules; centrioles were not visible due to this staining (d). Centrosomes were clearly detected (d′). Bars, 10 μm.
Figure 3
Figure 3
Percentage of cells with a centrosome 24 h after loading was determined by immunofluorescence with the 013 antibody. All cells loaded with mock IgGs presented a centrosomal staining (a), whereas the vast majority of GT335-loaded cells did not (b). All detected centrosomes were in the same focus on these selected fields. Percent of cells displaying a centrosomal labeling was determined under various conditions 24 h after electropermeabilization (c). N.E., nonelectropermeabilized cells; w/o Ab, cells electropermeabilized without antibody; 2–6 mg/ml, final antibody concentration for cell electropermeabilization. A maximal effect was reached at an antibody concentration of 4 mg/ml. Bars, 10 μm.
Figure 3
Figure 3
Percentage of cells with a centrosome 24 h after loading was determined by immunofluorescence with the 013 antibody. All cells loaded with mock IgGs presented a centrosomal staining (a), whereas the vast majority of GT335-loaded cells did not (b). All detected centrosomes were in the same focus on these selected fields. Percent of cells displaying a centrosomal labeling was determined under various conditions 24 h after electropermeabilization (c). N.E., nonelectropermeabilized cells; w/o Ab, cells electropermeabilized without antibody; 2–6 mg/ml, final antibody concentration for cell electropermeabilization. A maximal effect was reached at an antibody concentration of 4 mg/ml. Bars, 10 μm.
Figure 4
Figure 4
GT335-loaded cells present no visible microtubule disorganization. Cells collected 24 h after antibody loading were detergent-extracted and processed for immunofluorescence with antitubulin (a and b) and 013 anticentrosome (a′ and b′) antibodies. Comparison of microtubule networks from mock IgG–loaded cells (a) and GT335-loaded cells (b) showed no obvious differences. Centrosome staining was detected as discrete spots in control cells (a′) and as scattered foci in most GT335-loaded cells (b′). One cell in (b′) still possessed a centrosome (arrow). Bar, 10 μm.
Figure 5
Figure 5
Loaded cells have no functional microtubules nucleating centers. Control and GT335-loaded cells were treated with nocodazole and extensively washed to allow microtubule regrowth. Cells were further processed for double immunofluorescence with antitubulin (red) and anticentrosome (green) antibodies. Microtubules regrew as an aster focused on the centrosome in the control (a), whereas GT335 mAb–loaded cells displayed short individual microtubules disseminated in the cytoplasm (b). Pericentriolar material was detected by rabbit serum 013 close to the nucleus (c), where single microtubules were nucleated (c′). Bars, 10 μm.
Figure 6
Figure 6
Centrosome disappearance is transient. Cells loaded with GT335 antibody were collected every 12 h and processed for immunofluorescence with an anticentrosome antibody. Percent of cells with a centrosomal labeling was determined over time (n = 200). Data presented here are means from two independent experiments. 97–100% of the control cells loaded with mock immunoglobulins displayed a centrosomal labeling (squares). By contrast, cells loaded with GT335 IgGs lost centrosomal labeling (circles) in the first 12 h. At this time, only 28% of the cells displayed a centrosomal labeling. Centrosomes were progressively detected anew within the cell population. At 84 h, almost all cells presented a centrosomal labeling.
Figure 7
Figure 7
GT335 mAb–loaded cells display mitotic figures with acentriolar poles. Cells were processed for immunofluorescence 24 h after antibody loading. The left columns represent GT335-loaded cells, and the right columns are control cells. (A–C) All cells were costained with GT335 antibody to detect microtubules and DAPI for nuclei staining. (A) Detection of the centrioles with an antibody against human centrin3 at different stages of mitosis. (B) Detection of the pericentriolar material by the 013 serum. (C) Detection of γ-tubulin. (D) Cells were costained with HsCen3p and with NuMA antibodies. Nuclei were stained by DAPI. Bipolar mitotic spindles with no centrioles were observed, showing some disorganization of the poles. However, these spindles seemed functional, as anaphase and cytokinesis figures were observed (A). Pericentriolar material was segregated in asymmetrical amounts and presented a nonfocussed organization. The selected cell presented no centrioles at both poles, as judged by the GT335 staining (B). γ-Tubulin was barely detectable at the poles, and it stained centrioles when present (arrow in C). NuMA was present at the acentriolar poles but showed some disorganization (D). Bars, 5 μm.
Figure 8
Figure 8
Cells were collected 24 h after electropermeabilization and were processed for electron microscopy. (A) Overview of a bipolar spindle. (B and C) Magnification of the poles from the same section as in A. Centrioles were not visible at both poles. (D) Monopolar spindle with chromosomes displaying a rosette configuration. The center of this mitotic figure contained no centrioles, as shown after magnification of two adjacent sections, presented in E and F. Bars, 1 μm.
Figure 9
Figure 9
Mitotic cell from a control population analyzed 60 h after loading with human nonimmune IgGs. This late prometaphase cell presented centriole pairs at both poles. (A–D) Adjacent sections of one pole. (E–H) Adjacent sections of the other pole. Bar, 500 nm.
Figure 10
Figure 10
Metaphase spindles assemble in cells collected 60 h after loading with GT335 mAb but present partial centrioles at their poles. (A) Overview of the spindle. (B) Eight adjacent sections of the upper spindle pole. (C) 14 adjacent sections of the lower pole. Note in both cases the presence of several abnormal centrioles (arrows). They seemed excluded from the pericentriolar cloud and presented a weak staining of the walls. Pericentriolar material, however, was visible at both poles. Bars, 1 μm.
Figure 11
Figure 11
Monopolar spindle observed 60 hours after loading with GT335 mAb. (A) Overview of the spindle. (B) Eight successive sections (thickness 0.25 μm each) through the pole of the spindle. Arrows point to centriole remnants. (C) Tomographic reconstruction of the centriolar remnant seen in B, section 7. Four axial sections of 3–4 nm are presented. Bars: (B) 1 μm; (C) 0.5 μm.
Figure 12
Figure 12
Growth of GT335 mAb–loaded cells. (A) Flow cytometry analysis of cell cycles show an increase in G2/M phases for GT335 mAb–loaded cells after 24 h. N.E., nonelectropermeabilized cells; w/o Ab, cells electropermeabilized without antibody; 2–6 mg/ml, final antibody concentration for cell electropermeabilization. (B) Cells were plated at low density after loading with GT335 mAb, and the number of cells per colony was determined 5 d later. Bars represent the percent of colonies in the corresponding size. For each colony size, the first bar (white) is for GT335 IgGs, and the second bar (black) is for control IgGs. The distribution of the colonies according to their size did not appear significantly different.

Similar articles

Cited by

References

    1. Audebert S, Koulakoff A, Berwald-Netter Y, Gros F, Denoulet P, Eddé B. Developmental regulation of polyglutamylated α- and β-tubulin in mouse brain neurons. J Cell Sci. 1994;107:2313–2322. - PubMed
    1. Baron AT, Greenwood TM, Bazinet CW, Salisbury JL. Centrin is a component of the pericentriolar lattice. Biol Cell. 1992;76:383–388. - PubMed
    1. Beatty, R.A. 1967. Parthenogenesis in vertebrates. In Fertilization. C.B. Metz and A. Monroy, editors. Academic Press, New York. 413–440.
    1. Bobinnec Y, Moudjou M, Fouquet JP, Desbruyères E, Eddé B, Bornens M. Glutamylation of centriole and cytoplasmic tubulin in proliferating non-neuronal cells. Cell Motil Cytoskel. 1998;39:223–232. - PubMed
    1. Bornens, M. 1992. Structure and function of isolated centrosomes. In The Centrosome. V.I. Kalnins, editor. Academic Press, San Diego. 1–43.

Publication types

MeSH terms