. 1998 Dec 14;143(6):1661-72.
doi: 10.1083/jcb.143.6.1661.

Calcium and protein kinase C regulate the actin cytoskeleton in the synaptic terminal of retinal bipolar cells

Affiliations

Calcium and protein kinase C regulate the actin cytoskeleton in the synaptic terminal of retinal bipolar cells

C Job et al. J Cell Biol. .

Abstract

The organization of filamentous actin (F-actin) in the synaptic pedicle of depolarizing bipolar cells from the goldfish retina was studied using fluorescently labeled phalloidin. The amount of F-actin in the synaptic pedicle relative to the cell body increased from a ratio of 1.6 +/- 0.1 in the dark to 2.1 +/- 0.1 after exposure to light. Light also caused the retraction of spinules and processes elaborated by the synaptic pedicle in the dark. Isolated bipolar cells were used to characterize the factors affecting the actin cytoskeleton. When the electrical effect of light was mimicked by depolarization in 50 mM K+, the actin network in the synaptic pedicle extended up to 2.5 micrometer from the plasma membrane. Formation of F-actin occurred on the time scale of minutes and required Ca2+ influx through L-type Ca2+ channels. Phorbol esters that activate protein kinase C (PKC) accelerated growth of F-actin. Agents that inhibit PKC hindered F-actin growth in response to Ca2+ influx and accelerated F-actin breakdown on removal of Ca2+. To test whether activity-dependent changes in the organization of F-actin might regulate exocytosis or endocytosis, vesicles were labeled with the fluorescent membrane marker FM1-43. Disruption of F-actin with cytochalasin D did not affect the continuous cycle of exocytosis and endocytosis that was stimulated by maintained depolarization, nor the spatial distribution of recycled vesicles within the synaptic terminal. We suggest that the actions of Ca2+ and PKC on the organization of F-actin regulate the morphology of the synaptic pedicle under varying light conditions.


Figures

Figure 1
Figure 1
Adaptation to light altered the morphology of the synaptic pedicle of depolarizing bipolar cells. (A) Fluorescence image of a transverse section of goldfish retina showing PKCα immunoreactivity in bipolar cells (green) and staining with TRITC-phalloidin (red). TRITC-phalloidin is concentrated in photoreceptors (PR), in the outer plexiform layer (OPL) containing horizontal cells and the inner plexiform layer (IPL) containing amacrine cells and the synaptic terminals of bipolar cells. The retina was dark-adapted. (B) Blow-up of the area in A indicated by the arrows, showing processes (arrowheads) and spinules (thin arrows) elaborated by synaptic pedicles in the dark. (C) An example of a light-adapted retina stained the same way. (D) Blow-up of the area in C indicated by the arrows, showing the smoother and more rounded shape of synaptic pedicles in the light. Bars, 30 μm.
Figure 2
Figure 2
Light-dependent changes in the morphology of the synaptic pedicle were correlated with changes in the distribution of F-actin and PKCα. (A) Fluorescence image of a transverse section of goldfish retina showing PKCα immunoreactivity in a depolarizing bipolar cell (green) and staining with TRITC-phalloidin (red). The retina was dark-adapted. (B) The image of PKCα immunoreactivity from A after thresholding to define the boundary of the cell (see text). (C) The image of phalloidin staining from A after superimposition of the boundary defined in B. D–F show a similar treatment of images obtained from a light-adapted retina. Bar, 10 μm. (G) The r.s.d. of the pedicle (expressed as a percentage of the mean radius) in the dark and light. (H) The mean intensity of PKCα immunoreactivity in the pedicle relative to the cell body in the light and dark. (I) The mean intensity of phalloidin staining in the pedicle relative to the cell body in the light and dark. Results in G–I were obtained from at least 30 measurements in two or more retinae. Student's t tests indicate significant differences between light and dark conditions at the 0.1% confidence level.
Figure 3
Figure 3
Depolarization stimulated the growth of an actin network in the synaptic pedicle of isolated bipolar cells. (A) DIC image of an isolated bipolar cell. (B) Fluorescence image of the same cell stained with phalloidin–Oregon green after incubation for 15 min in normal Ringer's solution. F-Actin was concentrated under the plasma membrane of the pedicle but not the cell body. (C) Fluorescence image of a cell stained with phalloidin–Oregon green after depolarization for 15 min in modified Ringer's solution containing 50 mM KCl. Note the growth of F-actin under the plasma membrane of the synaptic terminal. Bar, for A–C, 10 μm. (D) Confocal image of a synaptic pedicle stained with FITC-phalloidin after 20 min of depolarization in 50 mM KCl. Note the hotspots of F-actin at the plasma membrane and the sharp inner boundary of the network. (E) Intensity profile across the line shown in D. The depth of the F-actin network was estimated as the distances between the arrows (see text). (F) The intensity profile along a line drawn around the perimeter of the pedicle through the center of the network. The region containing significantly less F-actin corresponds to the area where the axon attaches to the pedicle. Note the relatively regular jumps in intensity indicating the existence of radially orientated actin filaments.
Figure 8
Figure 8
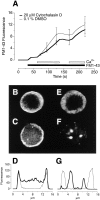
Disruption of the F-actin network did not alter the spatial distribution of recycled vesicles. (A) The time course of exocytosis measured from the increase in FM1-43 fluorescence. Experiments were carried out as in Fig. 7, except that a confocal microscope rather than a camera was used to image FM1-43 fluorescence. Each trace is the average of four experiments on different cells. (B) The distribution of FM1-43–labeled vesicles after 220 s in a control terminal. (C) The distribution of F-actin labeled with FITC-phalloidin in the same terminal as in B. (D) A plot of the intensity profile across the terminal in B and C. The thin line plots the FM1-43 fluorescence and the thick line plots phalloidin fluorescence. (E) The distribution of FM1-43–labeled vesicles after 220 s depolarization in a terminal treated with 20 μM cytochalasin D. (F) The distribution of F-actin labeled with FITC-phalloidin in the same terminal as in E. (G) A plot of the intensity profile across the terminal in E and F. Note that recycled vesicles labeled with FM1-43 remain concentrated in the periphery when the distribution of F-actin is completely disrupted.
Figure 7
Figure 7
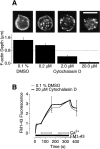
Cytochalasin D disrupted the actin network but did not affect continuous vesicle cycling. (A) The depth of the F-actin network after 2 min of depolarization under control conditions (0.1% DMSO) and in the presence of various concentrations of cytochalasin D (in which the cells were preincubated for 10 min). Representative images of phalloidin staining are shown above the corresponding bars. 2 μM cytochalasin D was sufficient to completely block growth of F-actin under the plasma membrane. The dashed line shows the mean depth of the actin network under resting conditions. Bar, 10 μm. (B) The time course of exocytosis measured with FM1-43. The graph plots the total FM1-43 fluorescence of the synaptic terminal (after subtraction of the background) under control conditions (0.1% DMSO, thin line) and in the presence of 20 μM cytochalasin D (thick line). Cells were continuously depolarized in 50 mM KCl. The filled bar shows addition of 10 μM FM1-43 and the open bar shows addition of 2.5 mM Ca2+. The rate of fluorescence increase on adding 2.5 mM Ca2+ was equivalent to 2.6 ± 0.8% s−1 of the plasma membrane area in cytochalasin D–treated pedicles and 2.3 ± 0.2% s−1 for controls. Each trace is the average of three experiments on different cells, and the bars show standard errors of the mean for two time points. All results were normalized to the resting fluorescence of the plasma membrane, which is plotted as a value of one.
Figure 4
Figure 4
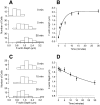
The time course of growth and breakdown of the actin network. Bipolar cells were stimulated with Ringer's solution containing 50 mM KCl for various times, fixed and stained with fluorophore-phalloidin. The depth of the actin network was measured from profile plots of confocal images, as shown in Fig. 3. (A) Histograms of the depth of the actin network observed at rest (top), after 5 min of stimulation (middle), and 30 min of stimulation (bottom). Measurements from three experiments were pooled. (B) The mean depth of the actin network was plotted as a function of the duration of the depolarization. Each point was obtained from at least 90 measurements. The line drawn through the points is an exponential with a time constant of 3.5 min. (C) Bipolar cells were depolarized for 15 min in Ringer's solution containing 50 mM KCl with 2.5 mM Ca2+ and then transferred to a Ringer's solution containing 50 mM KCl with 0 Ca2+/1 mM EGTA for the times shown. The histograms show measurements of the depth of the actin network immediately after stimulation (top) and after 10 min (middle) and 30 min (bottom) in 0 Ca2+. (D) The mean depth of the actin network plotted as a function of time after removal of Ca2+. The solid line through the points is an exponential that approaches the dashed line (the mean depth of the actin network under resting conditions) with a time constant of 35 min.
Figure 5
Figure 5
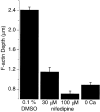
Growth of the F-actin network in response to depolarization required Ca2+ influx. The bar chart plots the mean depth of the actin network in the synaptic pedicle of bipolar cells depolarized for 15 min in Ringer's solution containing 50 mM KCl with 2.5 mM Ca2+ and either 0.1% DMSO vehicle, 30 μM nifedipine, or 100 μM nifedipine. Also shown is the depth of the F-actin network after depolarization in a solution containing 0 Ca2+/1 mM EGTA. Removing external Ca2+ or blocking L-type Ca2+ channels prevented growth of the F-actin network.
Figure 6
Figure 6
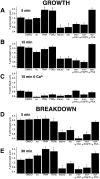
Activators and inhibitors of PKC affected growth and breakdown of the actin network in the synaptic pedicle. Bipolar cells were depolarized for 5 min in 50 mM KCl and 2.5 mM Ca2+ in the presence of the following substances: 0.1% DMSO, 100 nM 4α-phorbol (), 100 nM PMA, 10 nM PDBu, 1 μM staurosporine (stauro), 500 nM bis, 10 μM myr-ψEGF-R, 10 μM myr-ψPKC, and 10 μM myr-ψPKA. The bar charts plot the mean depth of the actin network in each condition. A–C show effects on growth of the actin network, and D and E show effects on breakdown. Asterisks mark test conditions in which there was a difference in the depth of the actin network compared with control conditions. (A) Effects on growth observed after 5 min of depolarization in the presence of 2.5 mM Ca2+. (B) Effects on growth observed after 15 min of depolarization in the presence of 2.5 mM Ca2+, when, under control conditions, the actin network reached maximal depth (Fig. 4). (C) Effects on growth observed after 15 min of depolarization in the presence of 0 Ca2+/1 mM EGTA, when there is normally no growth of the actin network (Fig. 5). (D and E) The bar charts plot the mean depth of the F-actin network in cells depolarized for 15 min in the presence of 2.5 mM Ca2+, then transferred to 0 Ca2+/1 mM EGTA for 5 min (D) and 30 min (E). Note that pharmacological agents were only applied during the period in 0 Ca2+.

Similar articles

Cited by

References

    1. Bailey CH, Thompson EB. Indented synapses in Aplysia. . Brain Res. 1979;173:13–20. - PubMed
    1. Behrens UD, Wagner HJ. Adaptation-dependent changes of bipolar cell terminals in fish retina: effects on overall morphology and spinule formation in Ma and Mb cells. Vision Res. 1996;36:3901–3911. - PubMed
    1. Bernstein BW, Bamburg JR. Cycling of actin assembly in synaptosomes and neurotransmitter release. Neuron. 1989;3:257–265. - PubMed
    1. Bernstein BW, Dewit M, Bamburg JR. Actin disassembles reversibly during electrically induced recycling of synaptic vesicles in cultured neurons. Mol Brain Res. 1998;53:236–250. - PubMed
    1. Betz WJ, Henkel AW. Okadaic acid disrupts clusters of synaptic vesicles in frog motor nerve terminals. J Cell Biol. 1994;124:843–854. - PMC - PubMed

MeSH terms